

A Chart of TSLA.
A unique chart setup for Tesla.


Let’s look at a few charts of Tesla (TSLA) for fun.
Will it break through to the upside? Or will turn over and go lower?
My bias is lower. But we shall see.
**Disclaimer: this is not investment advice. I own NO shares of TSLA. This is merely some good old fashioned technical analysis and is intended for educational purposes only.
Chart 1: 📊
Daily chart, going back a year
No lines, no bias

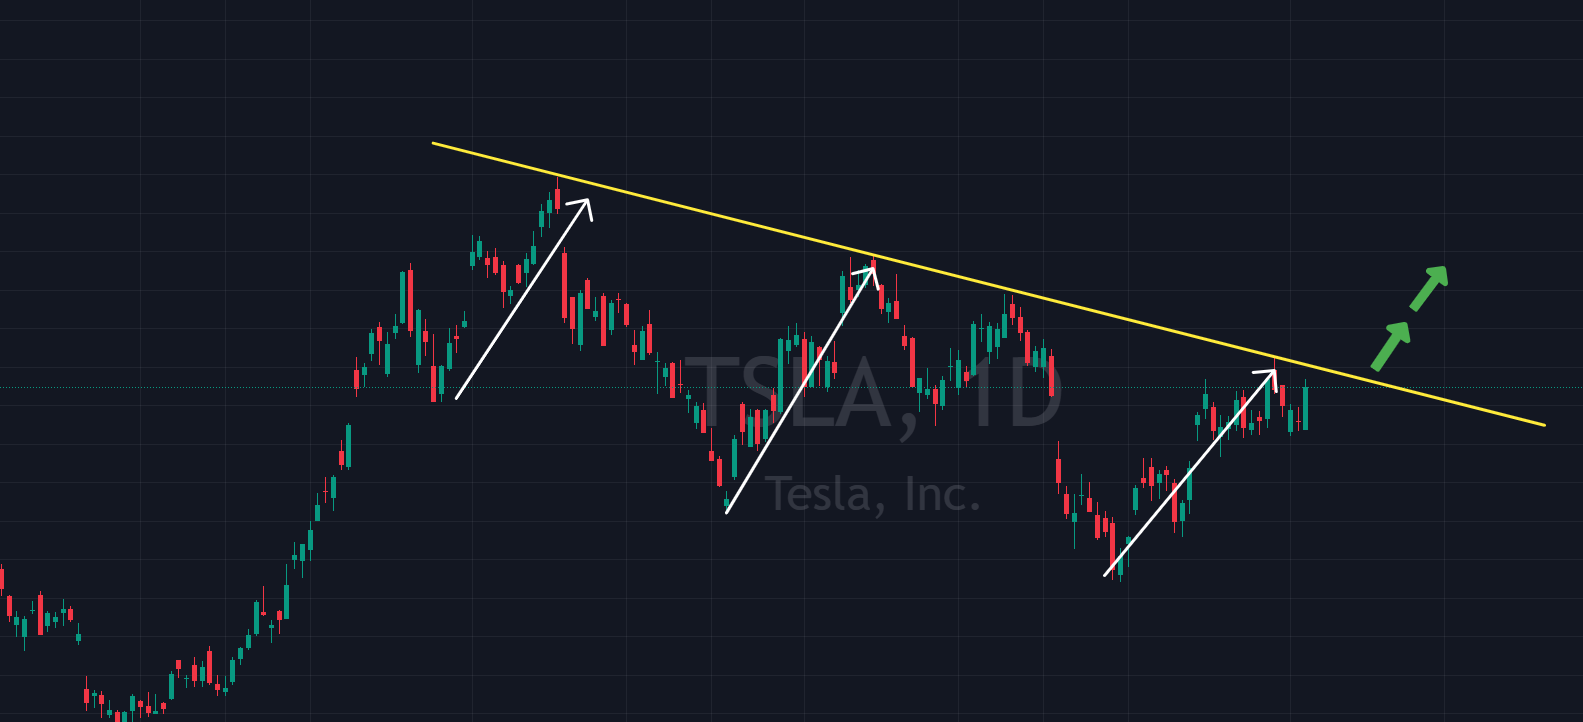
Chart 2: 📊
Same chart, lines and pivot points added
Downtrend line since July; price bouncing off yellow resistance line
Gap shown from January of 2023 - will it get filled? They always do…eventually.

Chart 3: 📊
Same chart, lines drawn another way
Price defined within wedge pattern - against resistance
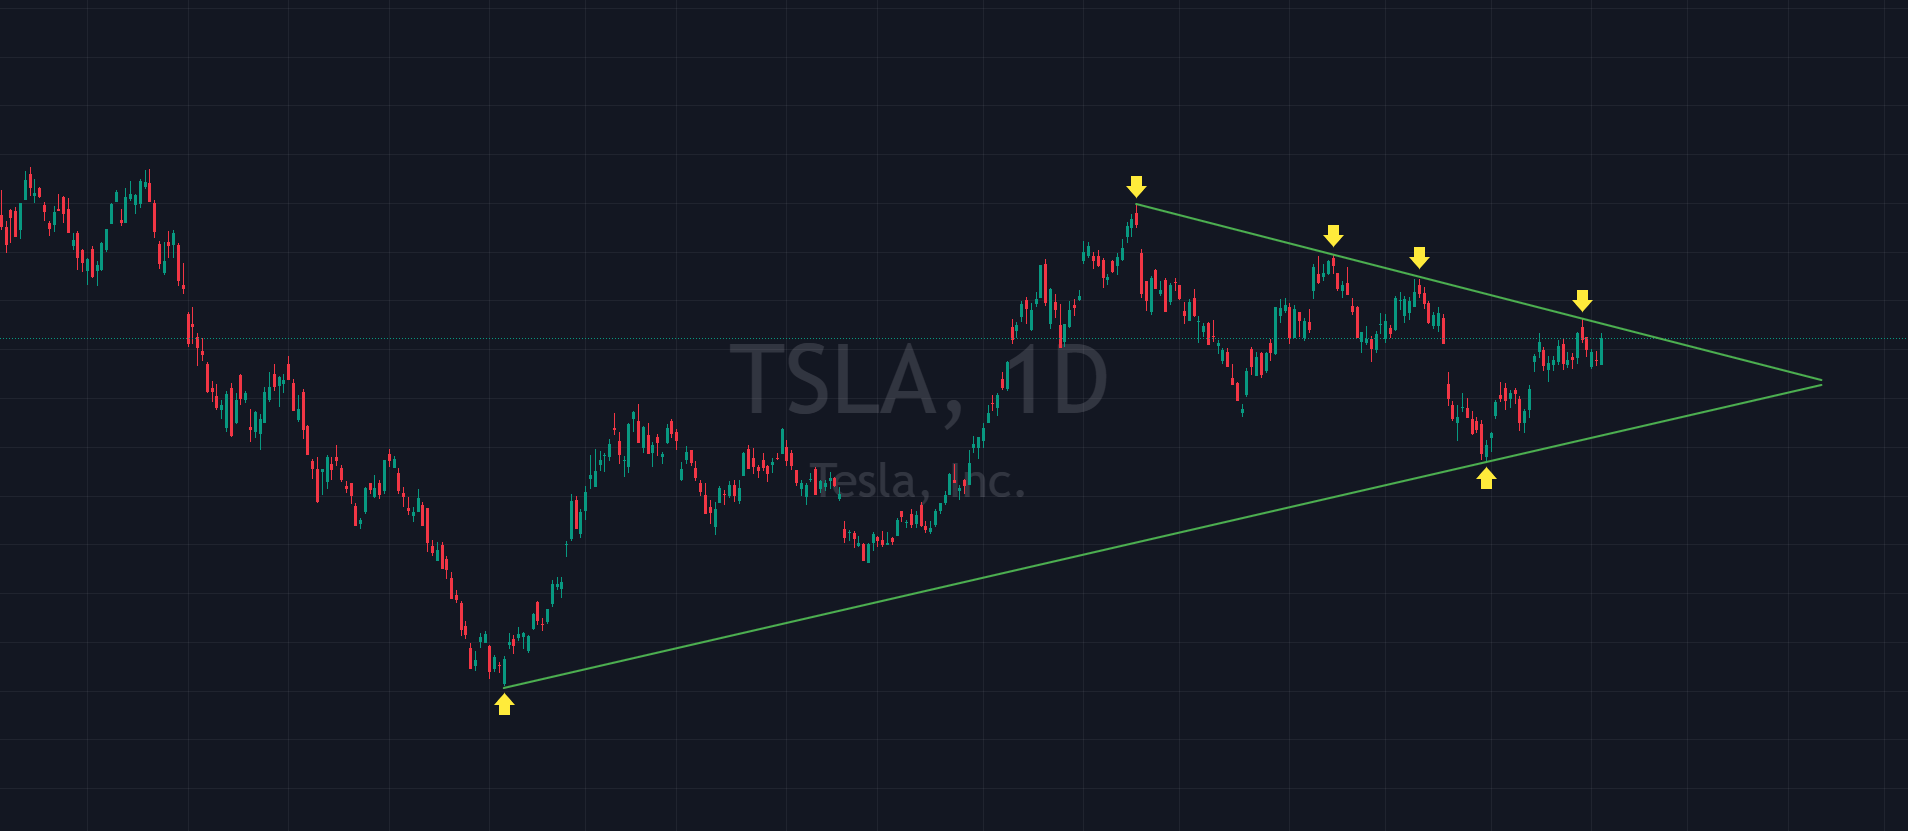
Chart 4: 📊
Same wedge as above
Support and resistance points added - yellow arrows
Possible downside price target 10% lower from here

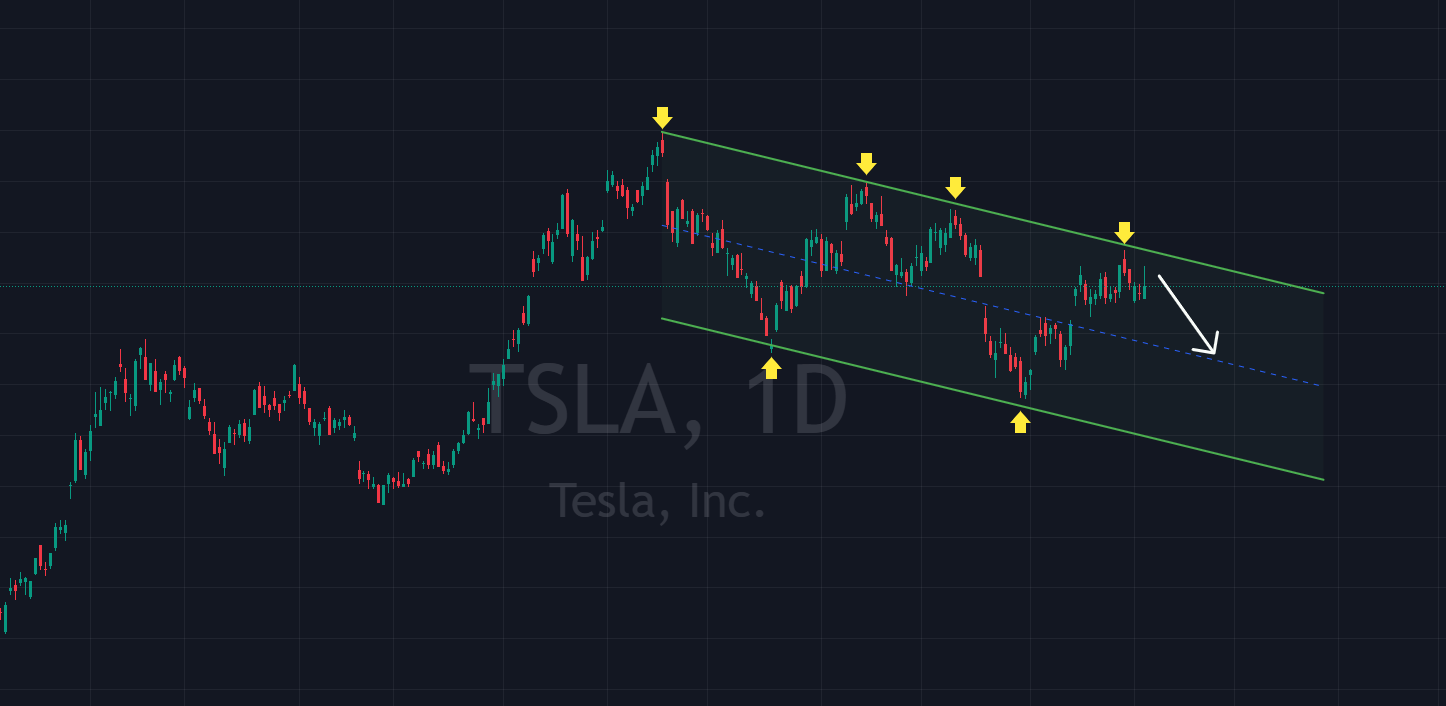
Chart 5: 📊
Same chart - lines drawn yet another way
Price defined within a channel where price is near the top of that channel
Possible downside to the lower rail or at least the midline (blue dots)
So the question is…does Tesla break lower from current levels…or break through and up? 👇
🕰️ My bias is to the downside. Time will tell…and we shall see.
Thanks for reading.
Eric