
A New Chapter: Welcome to The Technical Trading Report --- Formerly The Tobin Report.
A fresh start, a refined approach, and a new weekly resource for technical traders and investors.

Hi everyone,
If you’ve been subscribed for a while, you may notice things look a little different.
The Tobin Report is now The Technical Trading Report.
Introducing the Trend Score Matrix
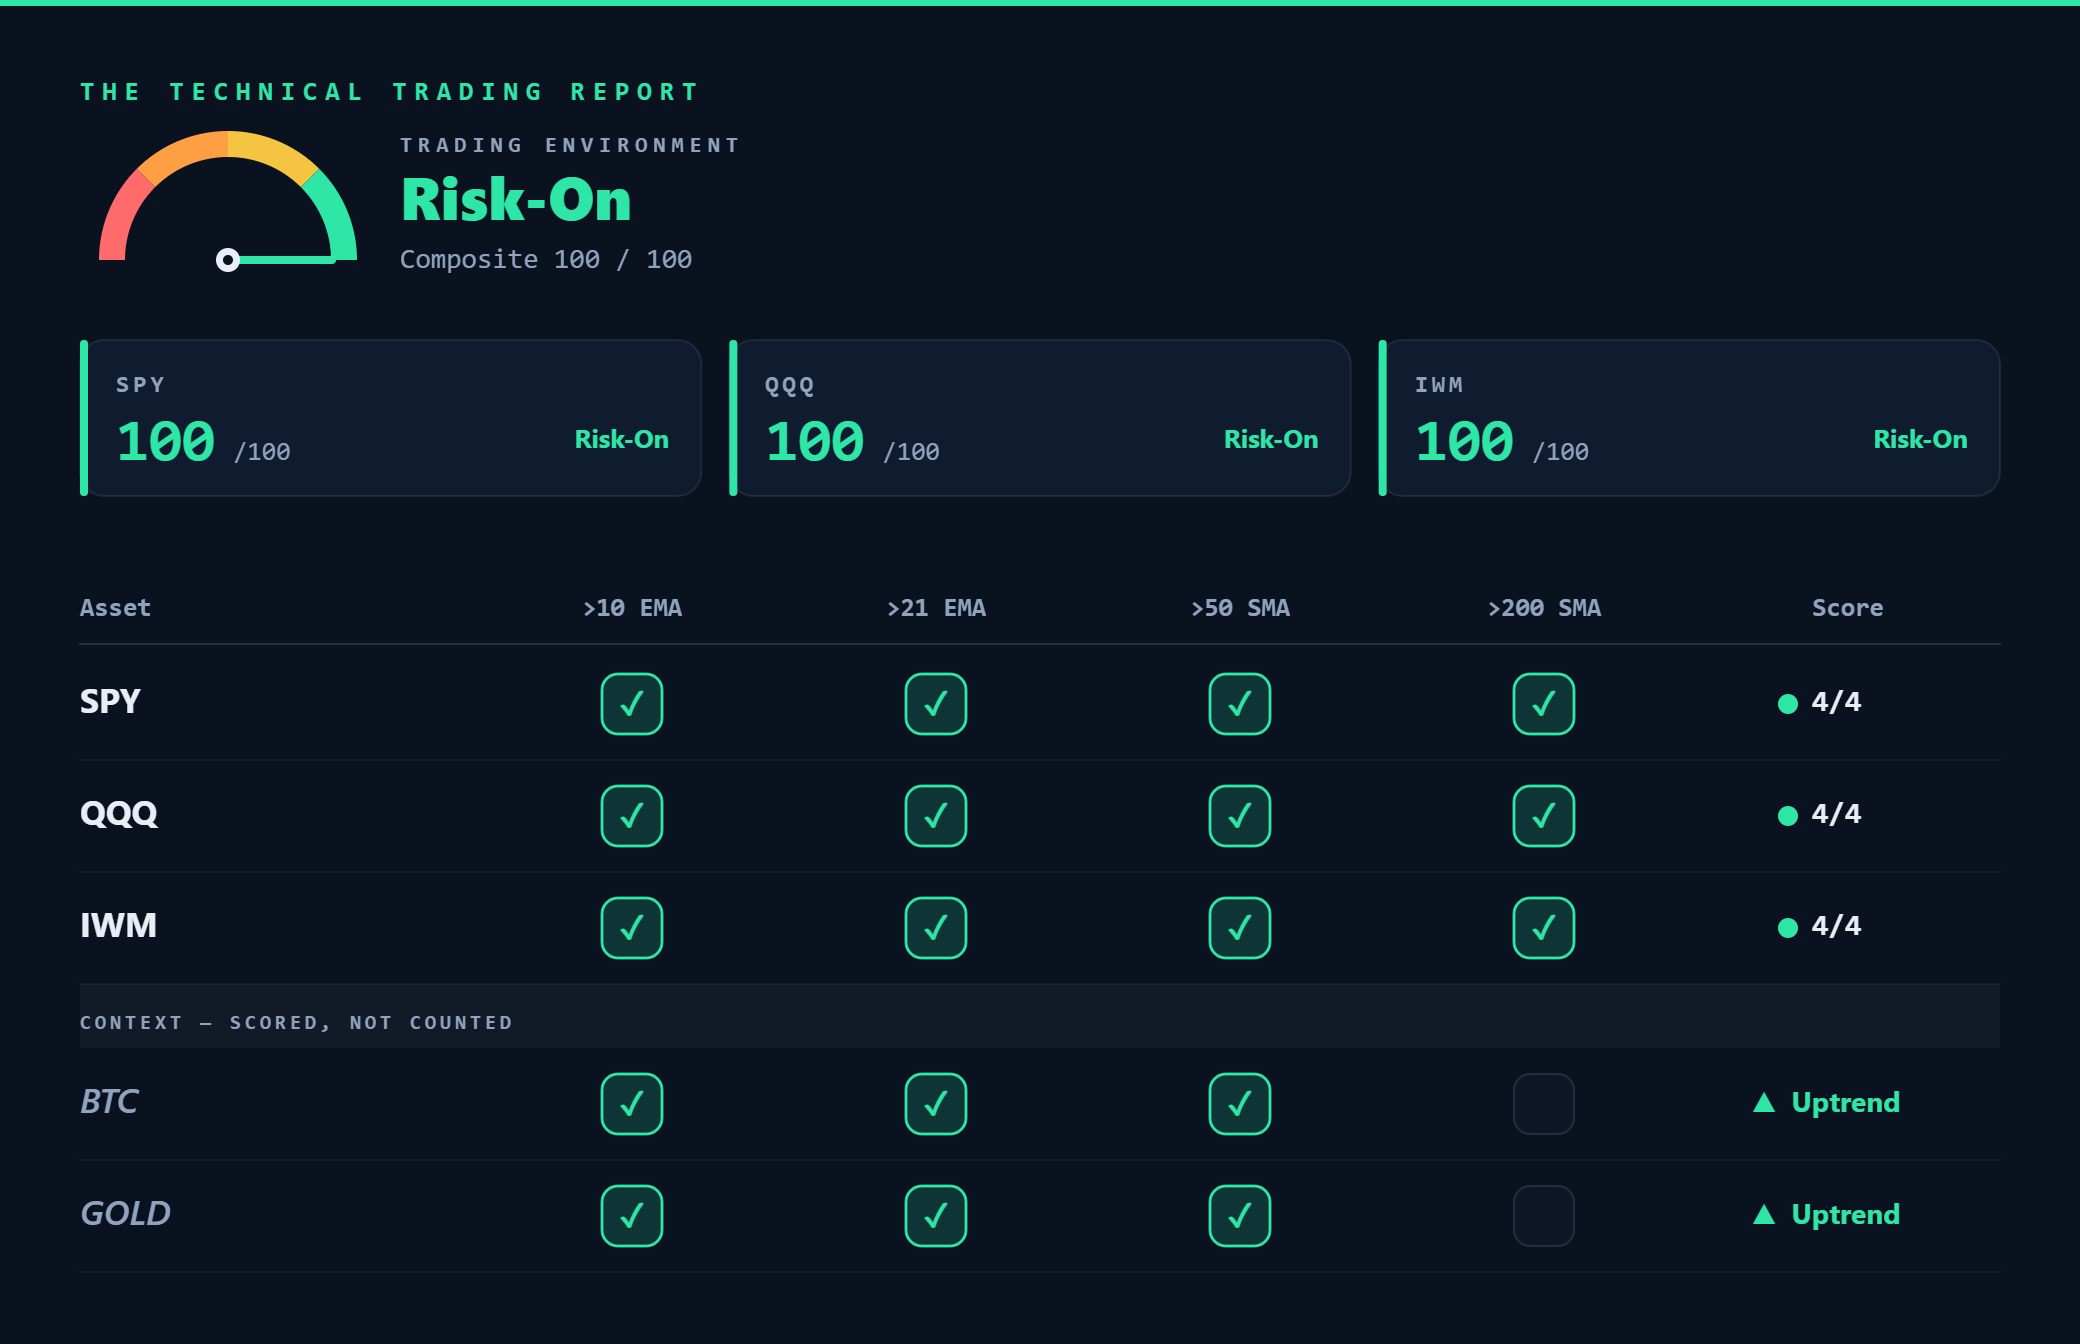

Each week, I score the market's major indexes — the S&P 500 (SPY), Nasdaq 100 (QQQ), and Russell 2000 (IWM) — against four key moving averages: the 10 EMA, 21 EMA, 50 SMA, and 200 SMA. For each market, I tally how many of those averages price is holding above. Those points roll up into a single composite score that shows, at a glance, what kind of environment we're in — from defensive to risk-on.
I've also added Bitcoin and Gold as a trend for broader context.
The goal is simple: Instead of guessing or reacting to headlines, you get one clear, consistent, objective snapshot of the trend every single week. No opinions, just where price actually is relative to the lines that matter.
The Approach
Moving forward, The Technical Trading Report will focus exclusively on a top-down approach:
Overall market structure — are markets strong and above key moving averages?
Sector rotation / themes — where are institutions buying?
Technical analysis
Identifying high-probability trading opportunities
Each week, I’ll share a comprehensive market report covering what I’m seeing in the major indexes, where leadership is developing, the sectors I’m watching, and the technical setups that stand out for the week ahead.
Here’s how each report flows:
Each week begins with a market outlook, because it drives every trading decision I make. If the market is in a Risk-On environment, I’m comfortable pressing the gas and taking more aggressive long positions. When conditions become Cautious or Risk-Off, I reduce position sizes, become more selective, or simply stay on the sidelines until the odds improve.
Once we’ve assessed the overall market, we shift our focus to sector and theme rotation. Where is institutional money flowing? By identifying the strongest themes and confirming they align with the broader market, we can narrow our search to the leading stocks within those groups and look for high-probability trade setups.
Finally, I’ll wrap up each report with a watchlist of charts and trade setups I’m monitoring for the week ahead — stocks that are either approaching actionable levels or already showing the characteristics I look for before entering a position.
A Live Look at the Process
For example, my theme tracker below shows us the top themes for the last month and week. This helps guide me as to where to go looking for setups. I want to be trading where money is flowing.
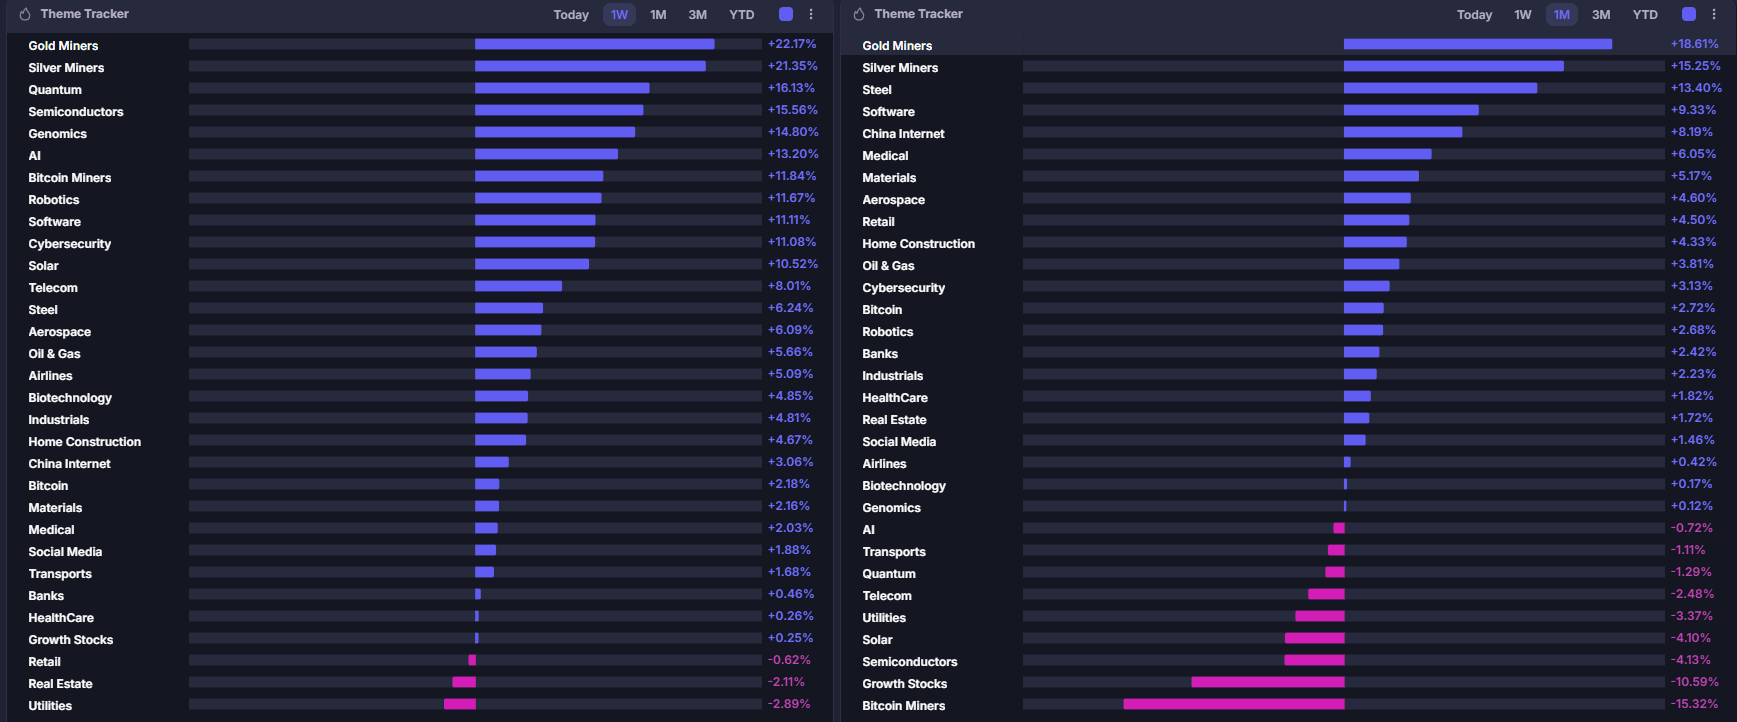
Gold/silver miners - Steel - Software are leading the charge for the month.
Gold/silver miners - Genomics - Software and Quantum for the week.
Follow Through Day (coined by the great William O’Neil)
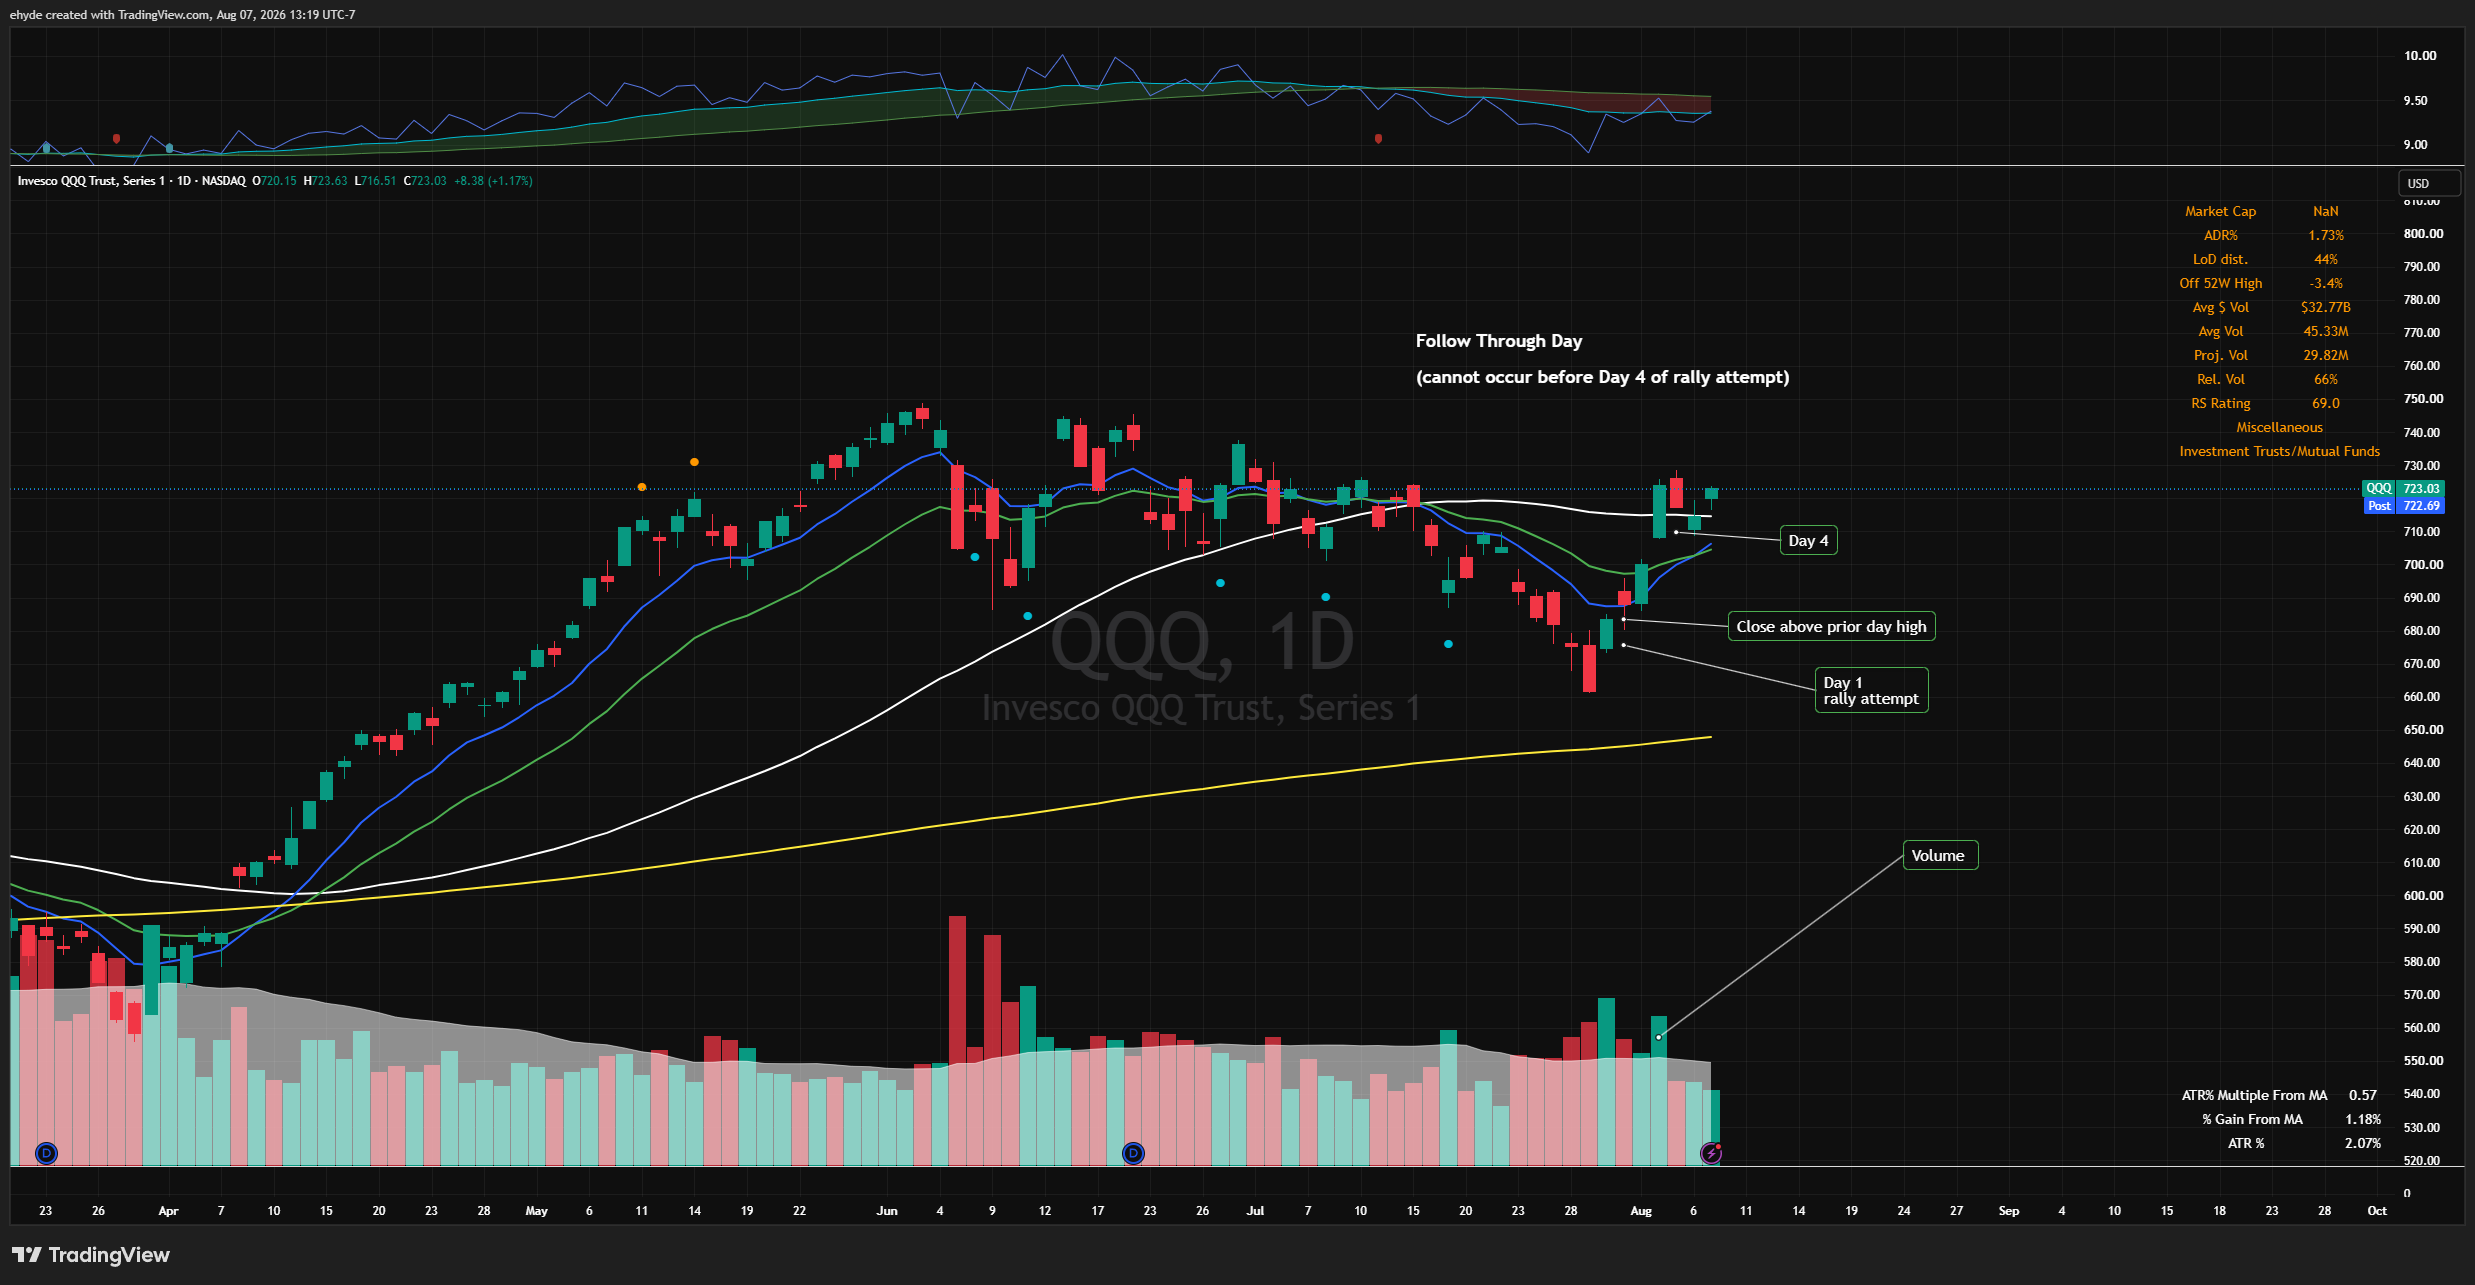
With a recent Follow Through Day, I'm seeing lots of setups and bases being built out. The QQQ chart above shows annotations from our recent low on July 29. Day 1 rally attempt on July 30 with a close above the prior day's high. The 10/21 EMA crossing over bullishly. Day 4 on volume confirms an FTD. Risk appears back on! My job is to closely monitor those moving averages and find good setups to extract money from the market.
Who this is for
Whether you’re an active trader, swing trader, or long-term investor looking to improve your timing, my goal is to provide practical, objective analysis that helps you make better trading decisions.
If you’ve been here since the Tobin Report days, I appreciate you sticking around.
If you’re new, welcome.
Consider this email a preview of what’s ahead. The first full issue of The Technical Trading Report will publish in the coming weeks as I put the finishing touches on the format. The timing is good — markets are currently coming out of a Risk-Off environment and now breaking above key moving averages. Lots of setups coming our way!
I won’t predict what will come, only decipher the charts and determine where we are.
Successful trading isn’t about predicting the future. It’s about recognizing probability, managing risk, and allowing price to confirm the story.
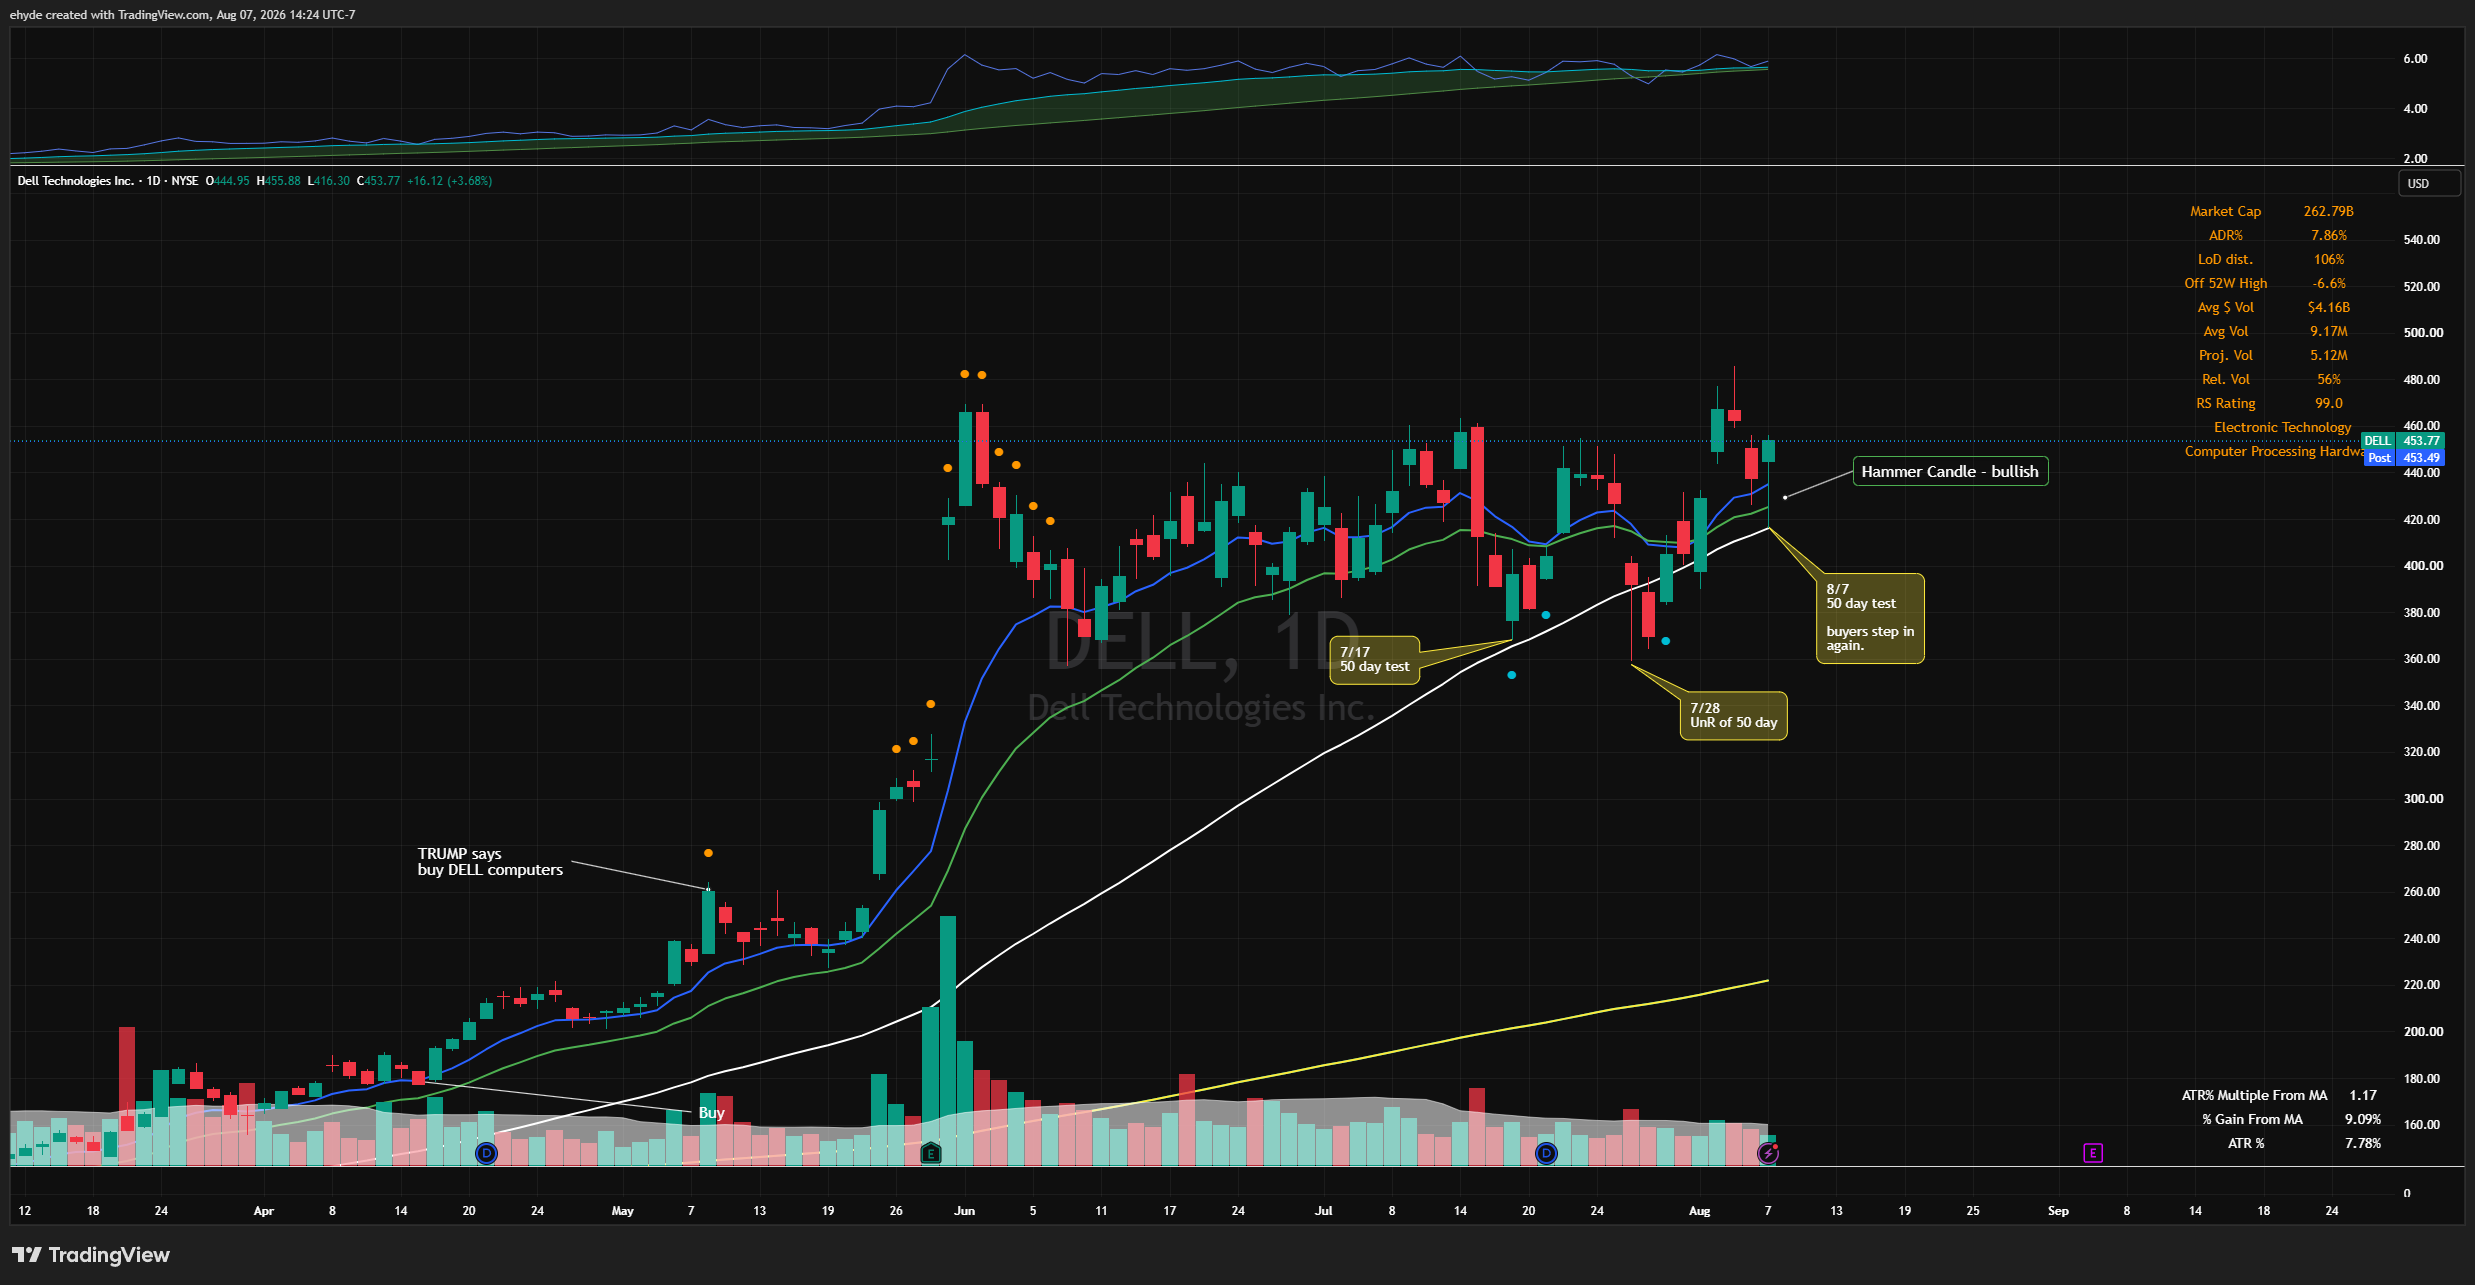
I'm excited to get back to sharing my process! A couple of charts I'm watching (and LONG):
HPE - recent test of the 50 day. Washout and tap of the 10 EMA. Great close.
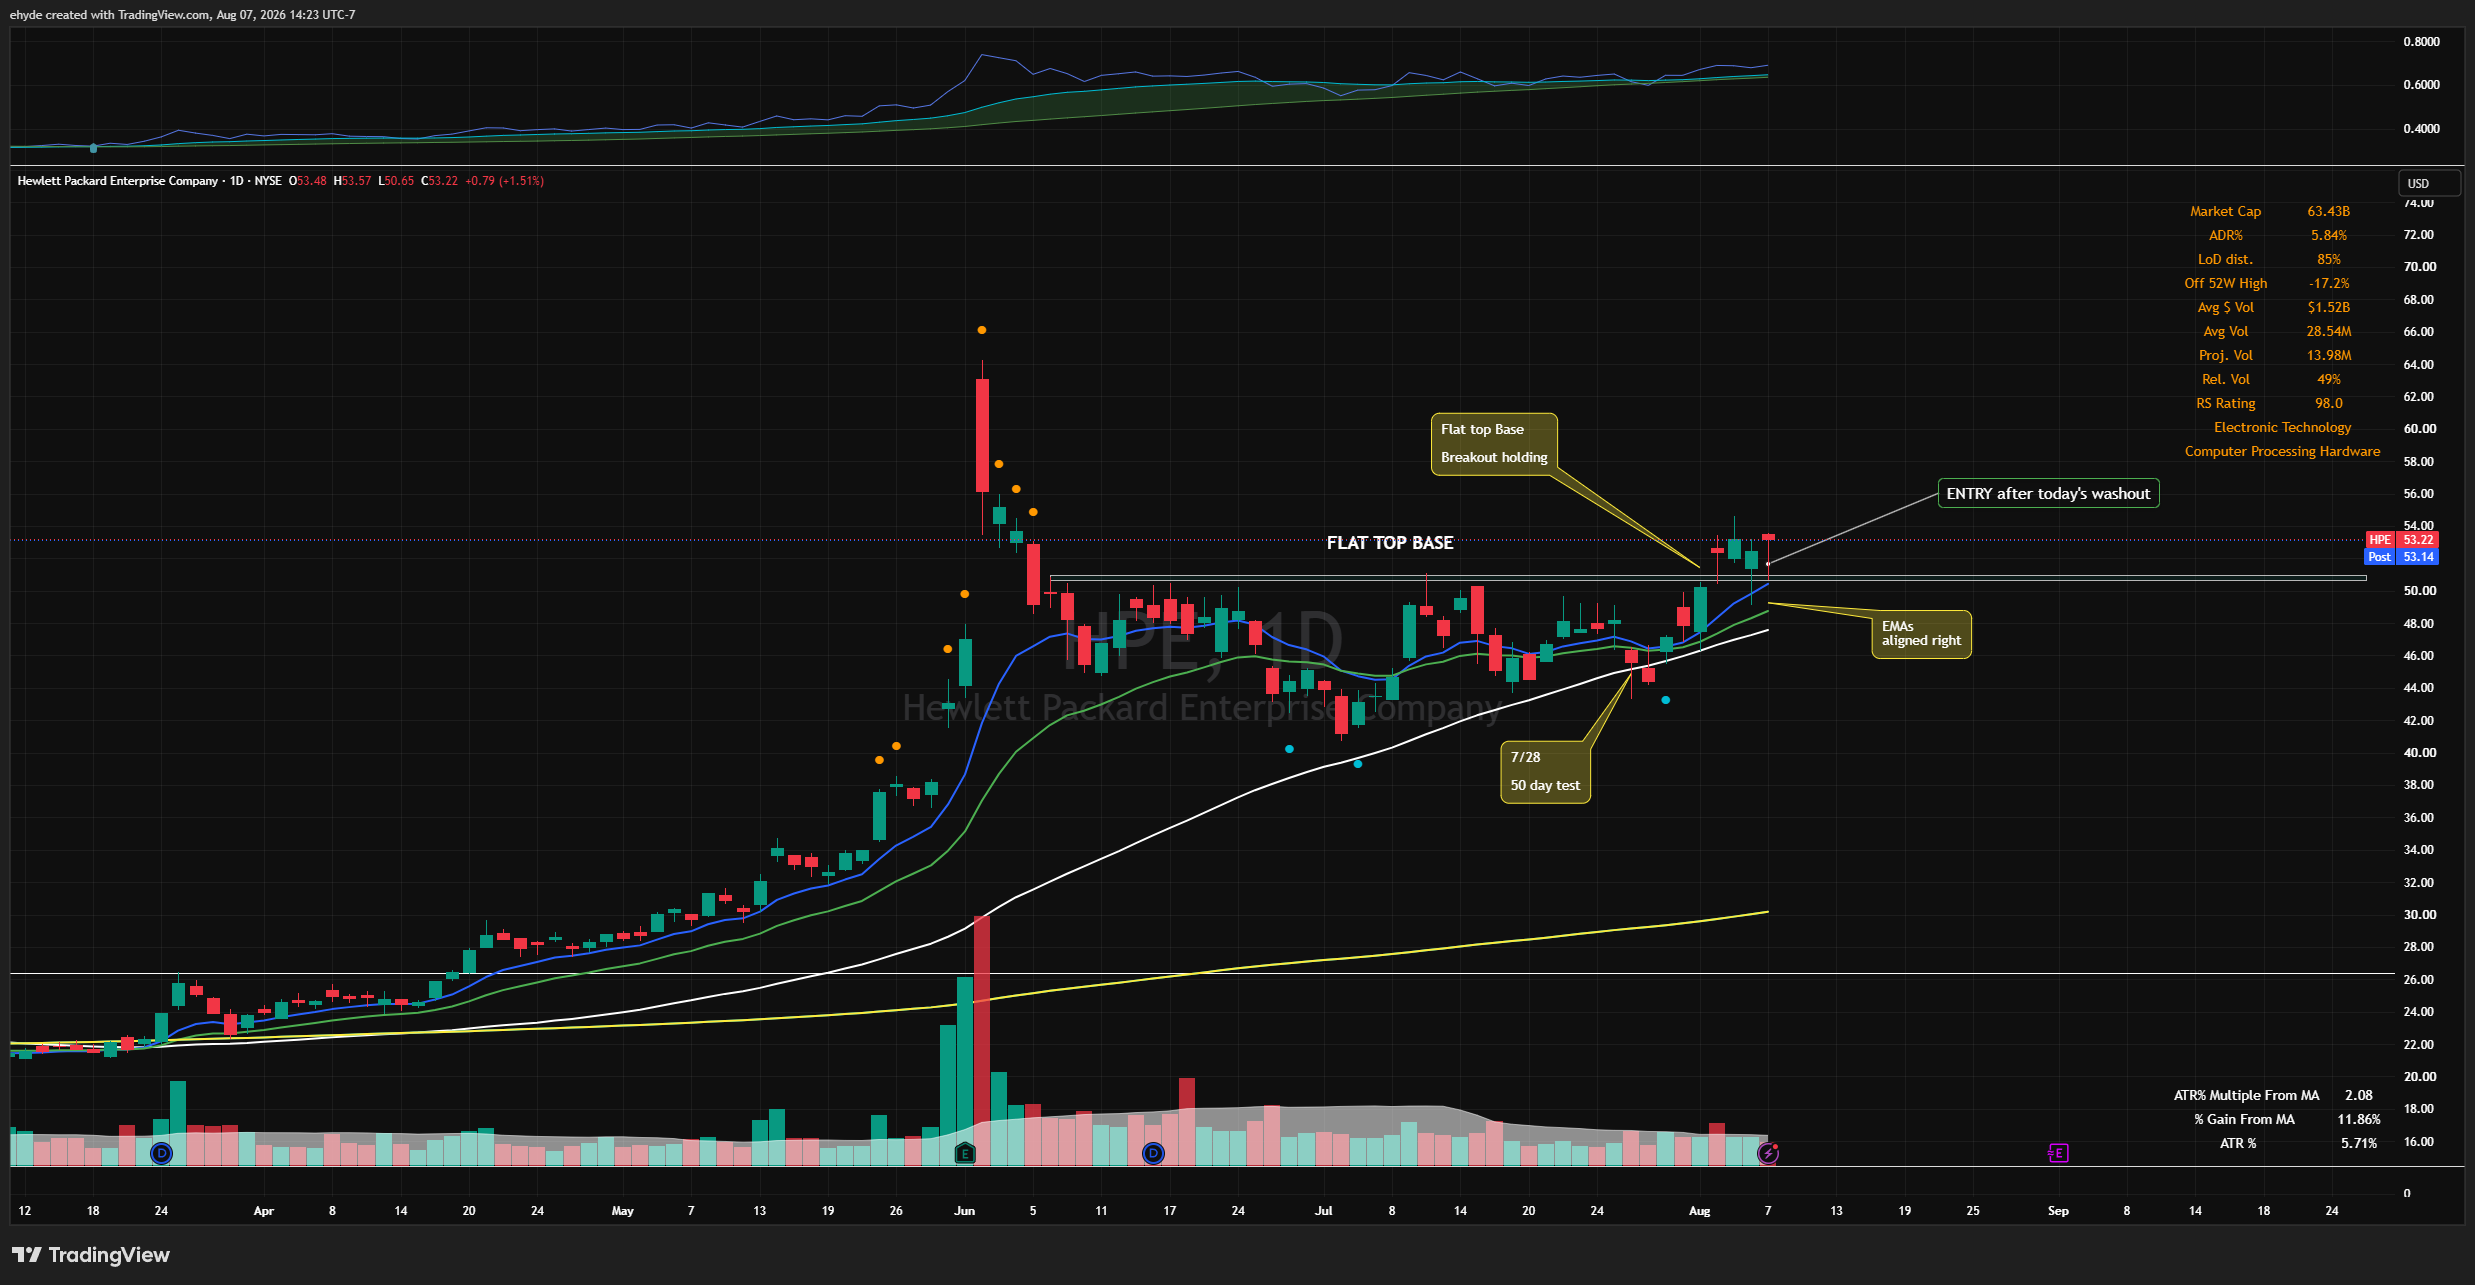
DELL - test of the 50 day, undercut and rally of the 50 day, nice hammer today.
Know someone who enjoys technical analysis, chart reading, or market strategy? Forward them this report and invite them to subscribe. I appreciate every recommendation and look forward to growing this community together.