
AMD
Critical juncture...

**I wrote this over the weekend so the charts are two days stale - price has moved up a couple points but all information below is still valid**

Let’s look at the chart of AMD. It’s at a critical juncture. Set aside what you know about the sector. Set aside your thoughts about the fundamentals. It doesn’t matter.
What matters is price action.
What matters is the chart.
AMD
🟢 Price is in a downtrend. Lower highs and lower lows. March 2024 to present.
🟢 Price must show strength and ultimately break the downtrend. Otherwise, the trend is still down.

🟢 Price is below all moving averages; 50 DMA in blue; 150 DMA in orange.

That said, let’s look at the positive. The risk to reward is highly skewed to the upside as long as you use proper risk management with stop loss orders.
Understanding price is still underneath resistance AND below moving averages…
🟢 Price IS sitting at 2-year support - literally AT support as I write this.
🟢 Wait for price to prove once again that this is STILL support - it must bounce exactly where we are if this remains support.
🟢 If you enter the trade here, set stop limits just below the blue support line for an easy exit OR wait for a break above the blue downtrend line.
🔴 If price breaks below the blue trend line, all bets are off and the pattern is invalidated.

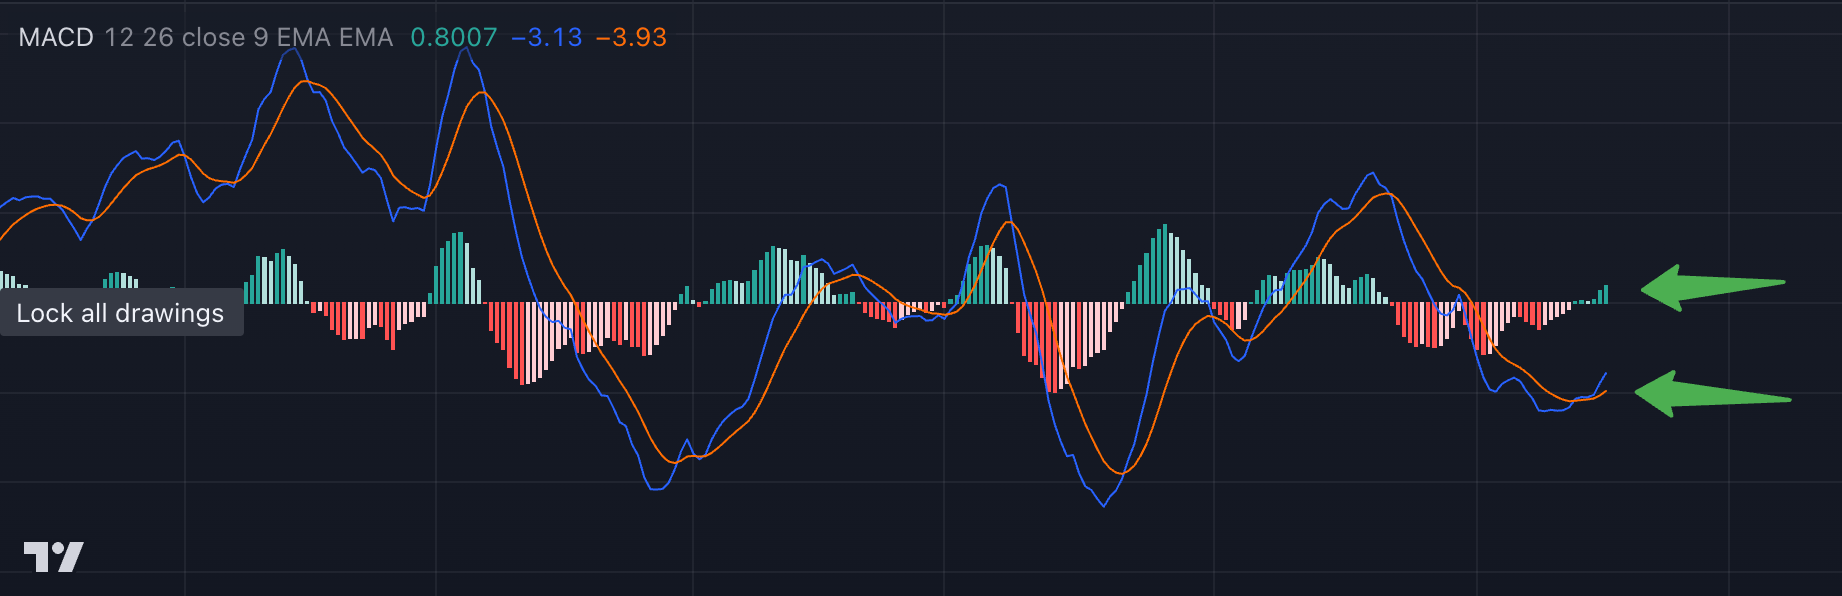
Lastly, I’ll throw in the MACD (moving average convergence divergence) indicator, which is flashing BUY.
🎯 My Trade
I bought AMD at $136 with a stop loss at $132.
My first initial upside target is $173 for a trade with a longer term target of over $215. However, there is still resistance to get through at the blue down trend line.
I’m risking $4 for an initial target of $36!

Remember, it never gets there in a straight line and anything can take it off track, so remember to raise your stops along the way. ALWAYS use good risk management.
That’s all for now,
Eric