
GOLD
Let's talk about gold, the dollar and a few chart setups.


Gold
Let’s keep it simple then move on to my favorite part: ➡ the charts.
I have been a self proclaimed gold “analyst” for years and have been shouting at anyone who would listen: GOLD IS GOING HIGHER! Pretty simple. But it is such an OBVIOUS trade. Seriously.
If you’ve read the Tobin Report and heard me talk about it and if you’ve done nothing about it…shame on you. I get it. You’ve had NVDA and the MAG 7. Fair enough.
But gold has been very quietly making new highs and I don’t think it’s being talked about AT ALL on the news. This is a GOOD thing. Shhhhh….let it sneak higher while our portfolio continues rocketing higher.
It means it’s nowhere near a top. A top will be marked when your mailman or gardener is telling you about gold. We don’t even have CNBC telling you about gold!
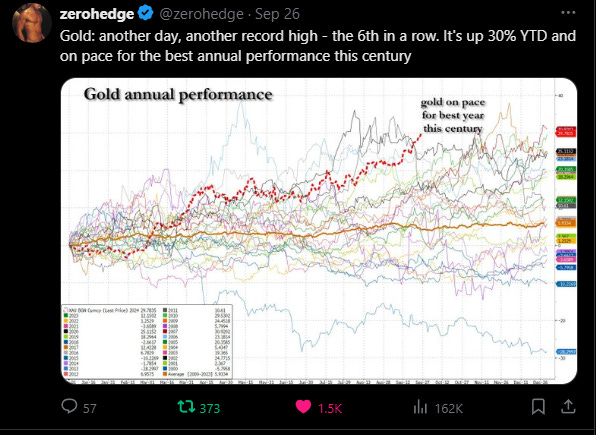
Did you know that Gold is on pace for its best annual performance this century?
Why Gold?
If you believe any of these are in the cards, this is why you buy gold…
✔ Inflation Concerns
✔ Global Economic Uncertainty
✔ Wars
✔ Weaker U.S. Dollar
✔ Lower Interest Rates
✔ Central Bank Buying
These are ALL happening. One or two would help gold but we have EVERY SINGLE ONE!
But let’s see what the chart of gold is telling me…
YUP…..it’s telling me the same thing. The chart told you BEFORE it told you.
What do I mean by that?
Here’s an analogy. (This is for all my cop friends who are reading this)
When a police officer detains a suspect and has him sit on the curb, the officer tells the guy to cross his feet. Why? Because if he’s going to run, he has to uncross his feet before he runs. That’s his tell. And if he does, in fact, uncross his feet, you KNOW it’s go time.

CHARTS
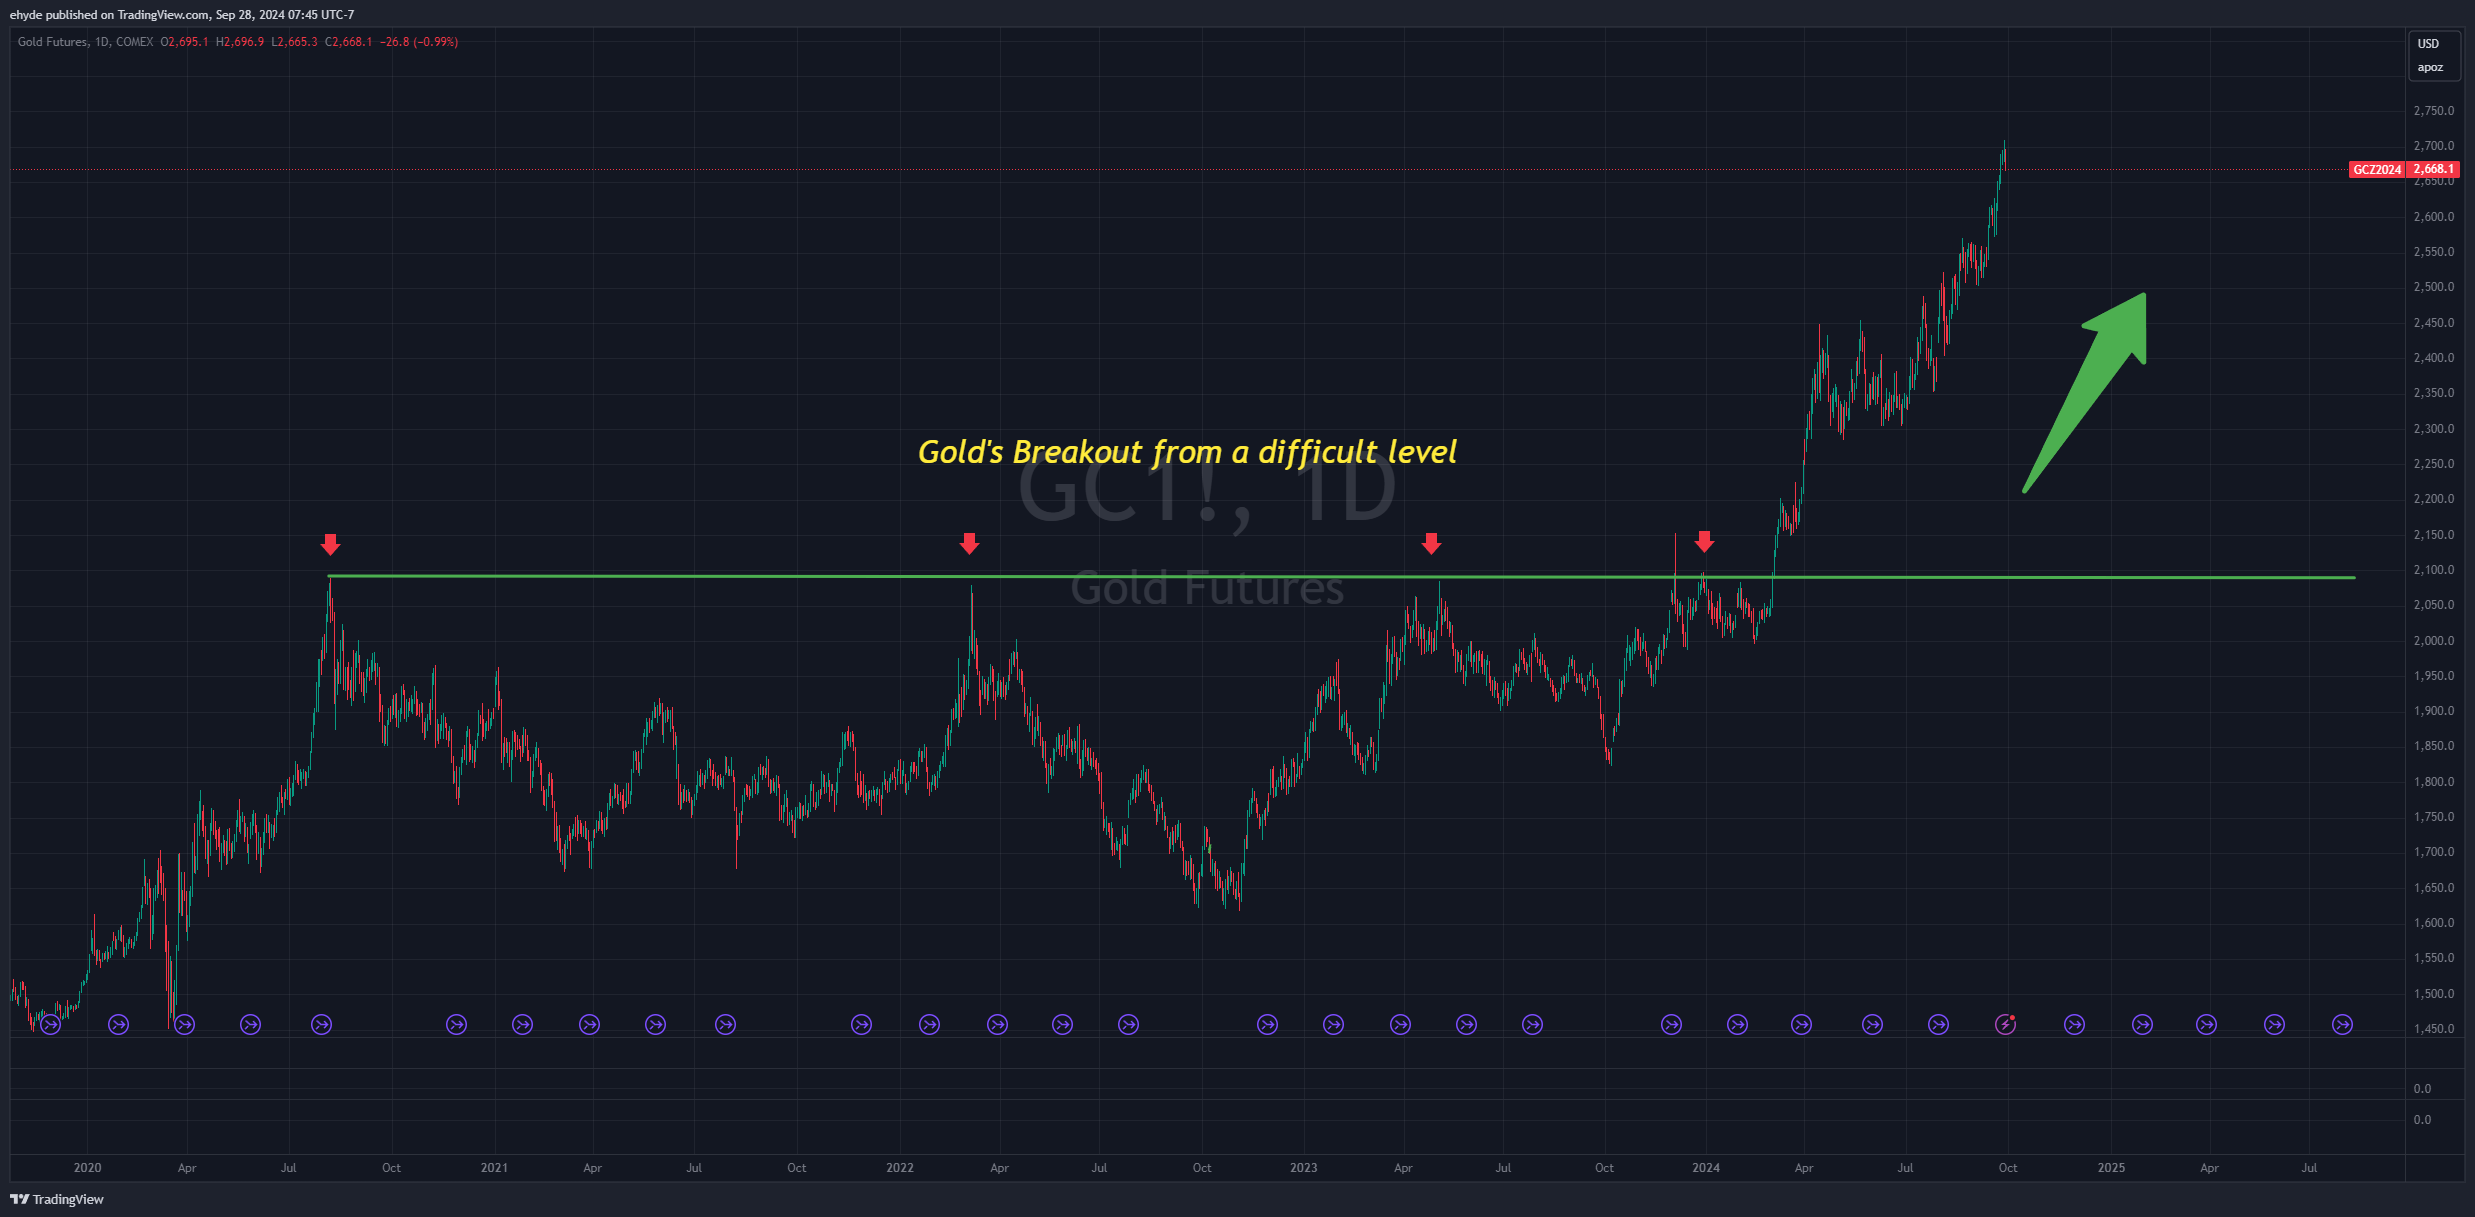
Same with charts. Look again at the chart of gold. There are many indicators, but let’s just focus on the simple one I’ve pointed out. We’ve established an area of resistance (green line) by tapping it multiple times (red arrows).
When price breaks above, it’s go time.
THAT is the suspect uncrossing his feet.
Okay, let’s move on.
The Dollar
The U.S. government PRINTS dollars with a stroke of the keyboard.
Literally.
The Fed has openly admits this is the case…even though we already knew that.
Typically gold is inversely correlated to the dollar. Dollar down, gold up.
You can see the chart below of the dollar, represented by the DXY index. Trend is down…and set up to potentially break support lower. Think of this as the inverse to the gold chart I showed you up above.
This will not happen overnight and takes time to play out, but look for a break lower of the dollar in the coming weeks and months.
🎯 Look for commodities and gold to take their next leg higher when that happens.

Okay, I said I’d keep it simple so I will leave it there. I don’t want to go too far down that rabbit hole. So, my general thesis has been GOLD UP, DOLLAR DOWN…but not in a straight line.
Newmont (NEM)
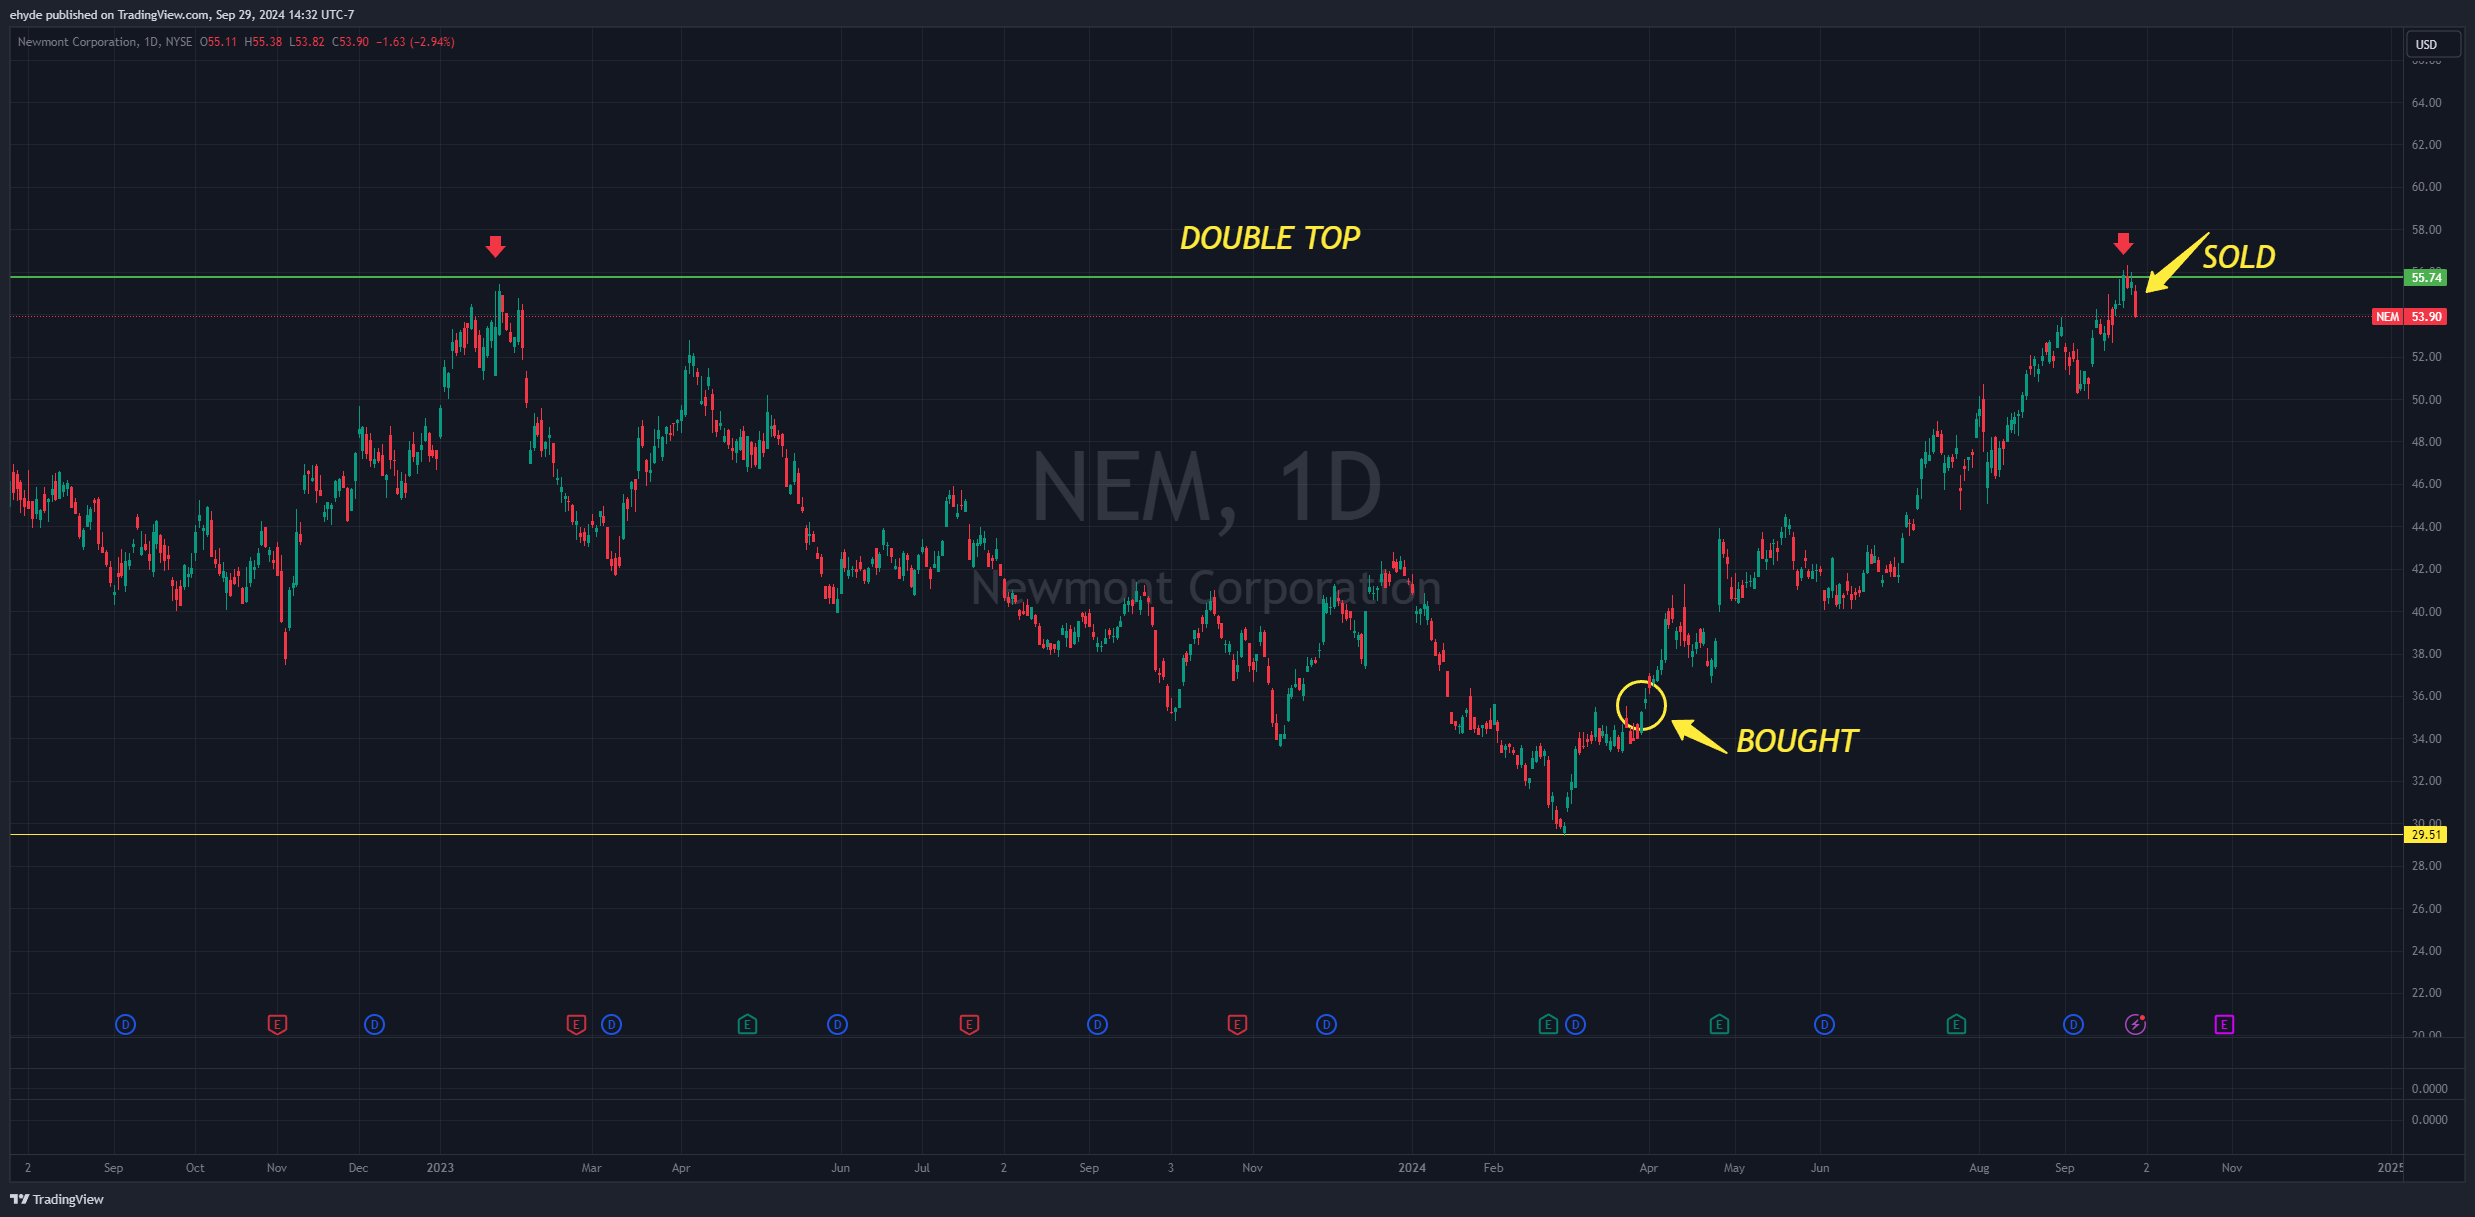
Look at the chart below of Newmont, one of the largest gold miners. I bought when price showed me a bottom had been formed. Over a 60% return in just a few months. Again, weak dollar, rate cuts were on the horizon, wars in the middle east, central banks buying gold hand over fist.
I sold last week.
So why did I sell if we are in this raging bull market?
Two reasons.
First, technical analysis told me it was time to sell…as a tactical trade. Price had run significantly and reached my target. Double top. This is a process and needs some time to breath and reset, like a marathon runner. After a big run, you rest for a bit.
Price has come down since I sold, VALIDATING my analysis. This is now an area of resistance. I will re-buy when we come down to support.
Second, I’m freeing up money to go down the food chain for smaller gold producers and developers. This is how money rotates in gold bull markets. We still have explosive moves ahead of us. Gold is due for a breather so I will add to my current holdings of gold miners that I expect to do well in the coming months. Companies like GoGold Resources (GLGDF), I-80 Gold Corp (IAUX), and Liberty Gold (LGDTF) to name a few.
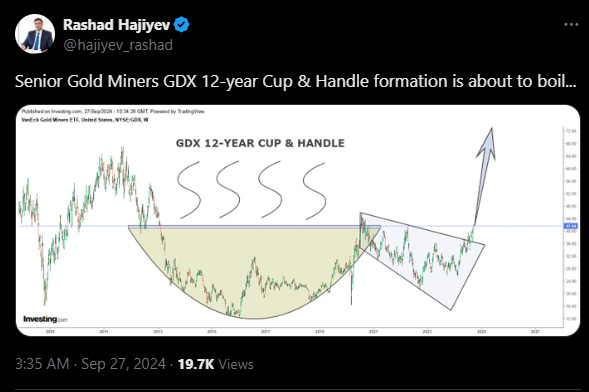
For those more interested in the basket of names with lower risk, you can always put your money to work in ETFs like the GDX and GDXJ or SIL and SILJ.
CHARTS
Let’s move on to some charts. These are charts that look poised to explode to the upside or have already moved substantially. I sometimes like to show the ones that have already moved because it demonstrates the power of technical analysis. These patterns repeat over and over throughout the market. EXCITING STUFF!
🎯 Charts like Jacob Solutions (J) or TeraWulf (WULF)
Jacobs Solutions - J
Long consolidation - breakout from a difficult level. THIS is why chart analysis is so important. Huge run up from the Covid low then a 3.5 year consolidation. Price breaks out from a difficult level and begins its next move higher.
It’s on a run.

TeraWulf - WULF
This was textbook breakout then retest. Price was consolidating within a range then broke out just under $3 and quickly doubled in just over a month. As you can see, price re-tested then got the green light to march higher.
How to trade this?
Option 1 would have been to buy when price broke above and ride it higher.
Option 2 is to wait for the re-test and confirmation to buy in.
I’m not giving my opinion from here but wanted to show an example of playing breakouts and retests.

Let’s Look at a Few More Ready to Go…
These next few I’m watching for a move higher based on what the chart is telling me.
Keep reading with a 7-day free trial
Subscribe to The Tobin Report to keep reading this post and get 7 days of free access to the full post archives.