


Gold Rockets to $2152 - NEW All Time Highs
This week I discuss gold's weekly and monthly close...as well as a few of my favorite junior miners in my portfolio.

Welcome back to The Tobin Report. All things money, markets and charts.

Let’s get to it…
This week, gold set a new WEEKLY closing all time high. And on the MONTHLY timeframe…samesies. This should come as no surprise if you’ve been paying attention.
ALL TIME HIGH👇

ALL TIME HIGH👇

For three years gold has been consolidating its significant gains made during the Covid 2020 run up to the $2075 level. After such a rally, consolidation was necessary in order to meaningfully break through the all time highs. And here we are……….at all time highs and ready to push through.
With the healthy 3-year consolidation just about complete, the subsequent breakout rally is likely to be spectacular.

A weekly-monthly-quarterly-yearly close above $2100 at the end of this month would likely trigger a strong advance in 2024 with a calculated target near $2500.
Yes, $2,500.
My target is not a guess or random number pulled out of the sky. It’s a calculation based on the chart pattern seen below.
Inverse Head & Shoulder Breakout
Statistically speaking, when price breaks above the neckline of an “inverse head and shoulders” pattern the odds favor a measured move similar to the measurements seen in the chart of gold below. Caution: this is not a guarantee…but probabilities are increased when the neckline is breached.

And the technical setup is aligned perfectly with the fundamentals of gold to run higher….real rates, end of the Fed tightening cycle, US debts, US deficit spending, de-dollarization, BRICS using gold as money, central banks record gold buying….and so on.
It’s gold’s time.

Okay, so gold from $2,000 to $2,500 may not seem like much…a mere 25% gain. The real torque is in the miners. If gold reaches $2,500, imagine what gold miners would do.
3x. 5x. 10x, in some cases. In fact, many of my holdings are already up over 50% in just the last several weeks. I have been buying weakness. That is the time to accumulate.
But let’s not get ahead of our skiis. I expect some significant resistance at current levels. Most likely a pull back. Let’s see how well gold can hold at current levels in the coming week. Will it get rejected hard or consolidate for a week or two before punching through all time highs?
Using the chart below of gold seasonality, we can see during the buy season of November/December, the first couple weeks of December are generally a buying opportunity on weakness.

Gold stocks have become technically short-term overbought. I would not be chasing here. However, where $2000 has been the ceiling for so long, it appears as though $2000 may be the new floor.
Recent weakness is now being bought quickly in the quality companies.
I sent the chart of GDXJ to you in last week’s Tobin Report, indicating a breakout.
Remember this one? 👇🏽

Well here we are now: 👇🏽

This is significant.
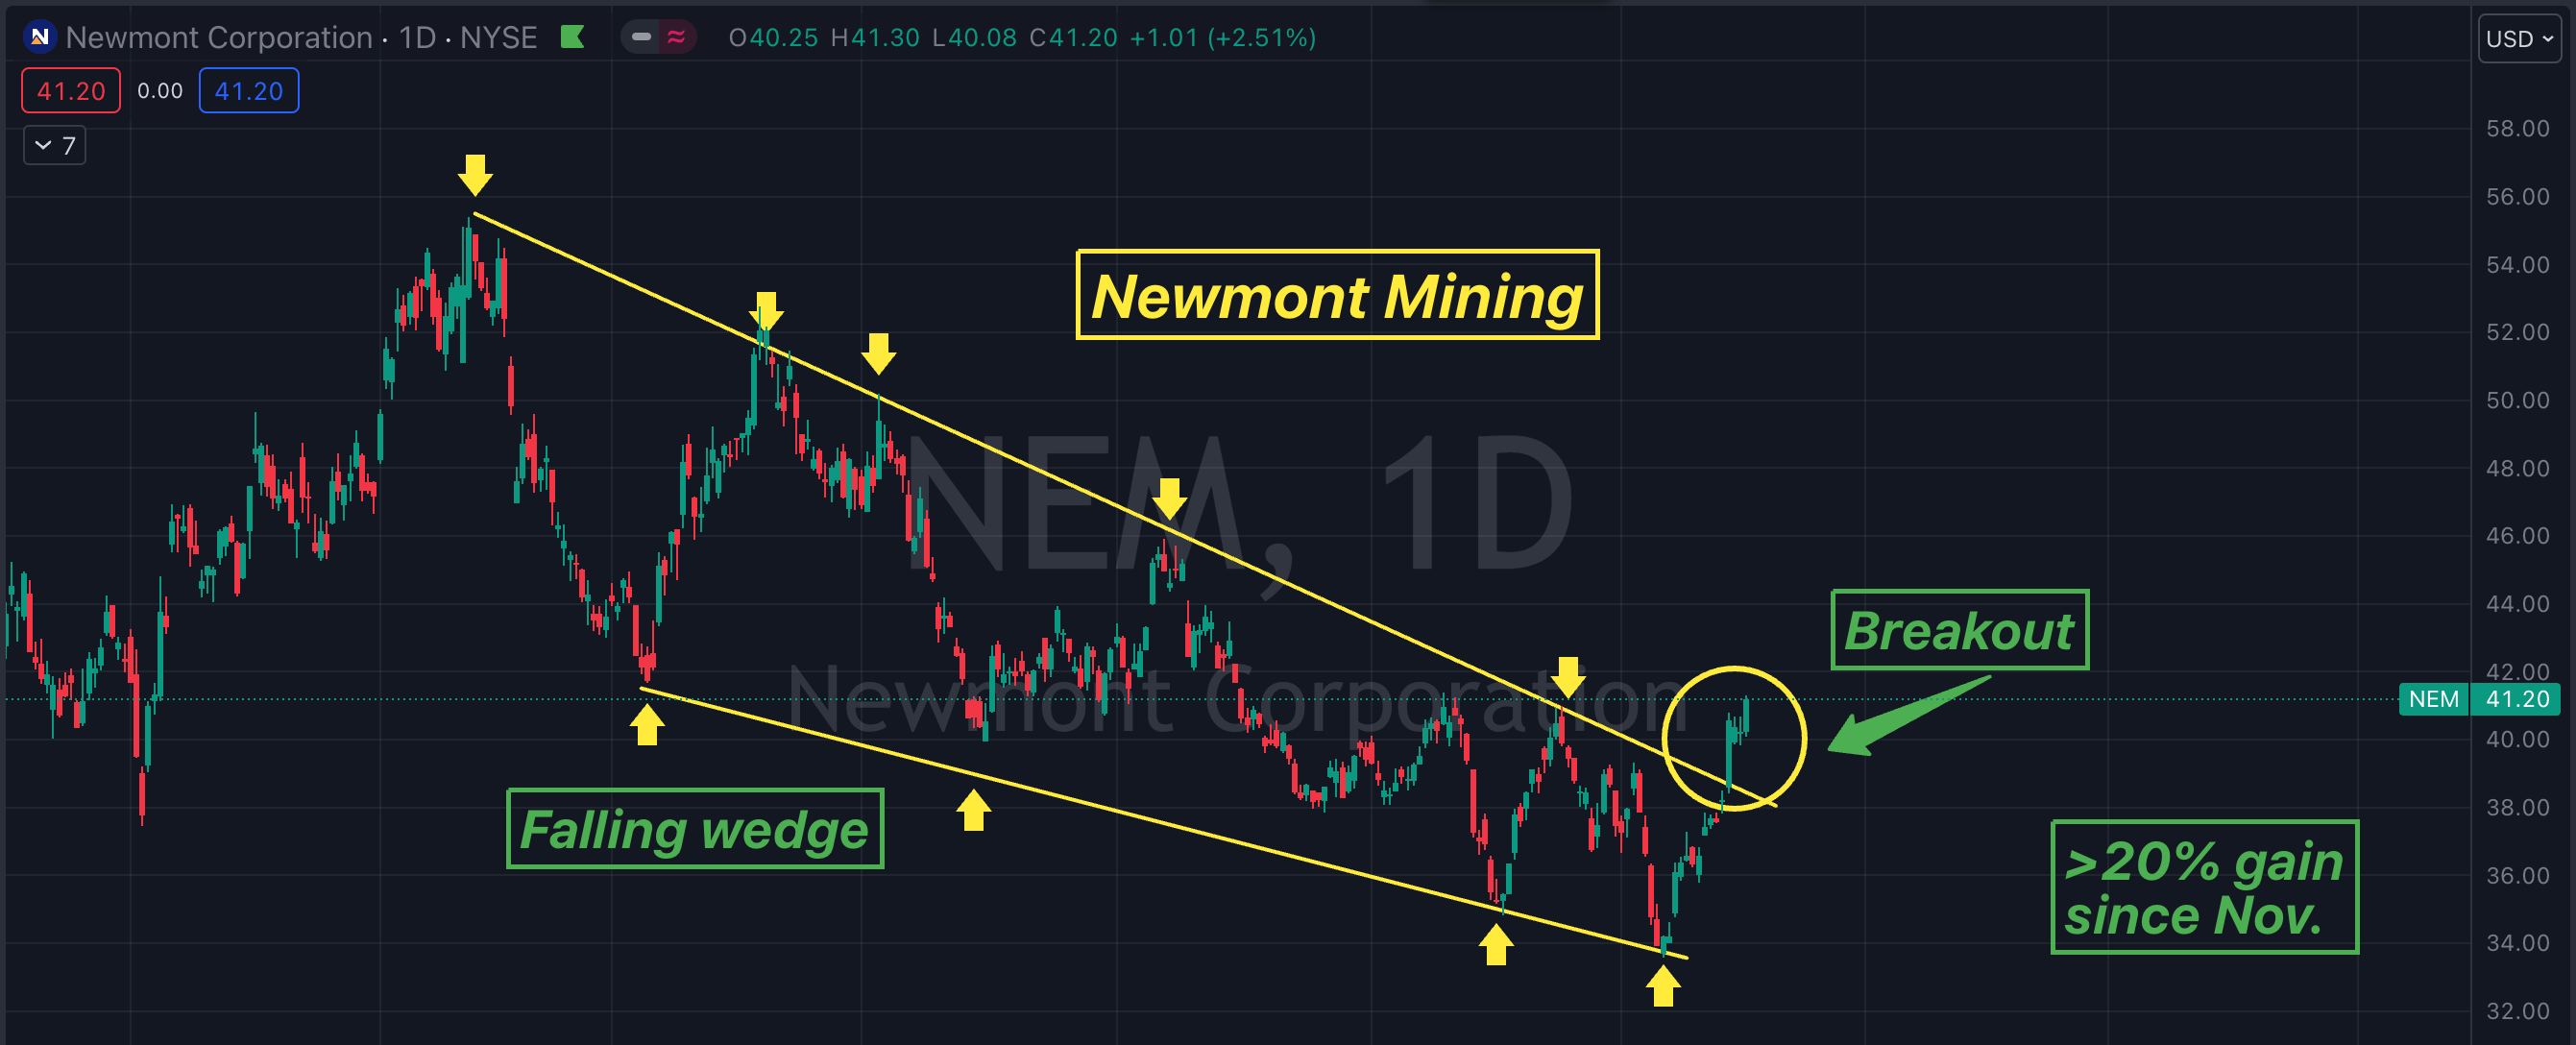
Breakouts in most gold companies are confirming the breakout in the metal itself. Look at the chart of Newmont Mining, the largest gold producer in the world. This is a breakout from a chart formation known as a ‘Falling Wedge’. It’s pretty self explanatory.
NEM is already up over 22% from recent capitulation lows.
With year end tax-loss selling and fund redemptions looking like they are in the rear view mirror (this is indicated by studying the charts) in many junior miners, this sector has seen its capitulation bottom. To that point, many of my junior mining company shares have already experienced significant gains this week…with strong volume.
Weakness should now be bought. Yup…….buy the dips. I’m referring to the dips in precious metals stocks, not the general stock market.
The last time we saw this kind of a setup in the gold stock complex was in late 2015 which proved to be a significant bottom. Once sentiment switched from ultra-bearish to newly bullish during the second week of 2016, both GDX and GDXJ (gold miner ETFs) surged over 140% in just 6-months, while several quality juniors experienced 5-10x gains.
The last two years have created a generational opportunity to accumulate significantly undervalued quality precious metals related mining companies ahead of the most important gold breakout in over 50-years. As I wrote in last week’s Tobin Report, and according to Bank of America, 71% of wealth advisors hold 0-1% of gold in their portfolios. And the mainstream media isn’t even paying attention!
Once gold breaks out to new all-time highs, momentum traders, fund managers, and your co-workers will all start piling into the under-owned space.
With most generalists investors still on the sidelines, it is best to position before everyone else.
Gold has already broken out in other currencies. Gold in the Japanese Yen offers a valuable roadmap.
A secular move in precious metals and the mining industry is likely in the making.
Look at the chart below.
Red: Gold priced in Japanese Yen has liftoff.
White: Gold in US dollars…ready to liftoff.

BREAKING NEWS: 📰🔴
As I sit here writing the last segment of The Tobin Report, the price of gold has broken decisively through its all time high of $2089 and currently up almost 3% at $2150!
Portfolio

To prepare for the next leg up of this bull market, I have been accumulating shares of many junior mining companies, many of which have recently bottomed.
Let’s take a look at a few of my leaders…👇🏽…and the ones I’ll be adding on weakness…
Keep reading with a 7-day free trial
Subscribe to The Tobin Report to keep reading this post and get 7 days of free access to the full post archives.