


Let’s start with a brief history lesson.
Chart 1 of 7
December 2018 to October 2020.
No lines. No bias. Price went up. Price went down. Price eventually broke out and went much higher. How much higher? 3x higher. In just a few months.
What company? Doesn’t matter. This is technical analysis.

Chart 2 of 7
Same timeline. Same chart. This time with lines and arrows. We see a clear downtrend within a perfectly symmetrical channel. Prices went up. Price went down. All within the down trend…
…until it broke ABOVE the parallel channel explosively. Price went from roughly $0.15 to $0.42, almost 3x in 5 months.

Chart 3 of 7
Same timeline. Same chart. No channel or lines. This time using a trend…the 150 day moving average. No bias. No opinion. Purely price action. Price kept getting pushed below the moving average…
…until it broke above explosively.

That was then.
This is now…same company. Still doesn’t matter which one. Technical analysis.
Will history repeat?
Chart 4 of 6
Different timeline. June 2021 to present day.
No lines. No bias. Price goes up. Price goes down.
Where does price go from here?
Having studied prior price action…can we determine future price movement?
Let’s keep looking…

Chart 4 of 7
Same timeline. Same chart. This time with lines and arrows. We see a clear downtrend, like we did in chart 2, within a perfectly symmetrical channel. Prices goes up. Price goes down. All within the down trend…again.
Next, we have a bottoming pattern that has consolidated for 4 months. Bullish.
Will price break ABOVE the parallel channel explosively? Might price run from the current $0.15 area to its recent $0.42 high?
…another 3x?
Let’s look for additional supporting clues.

Chart 6 of 7
Same chart but this time with the 150 day moving average. Again, price keeps getting pushed below as it did in 2018-2020 before breaking out.
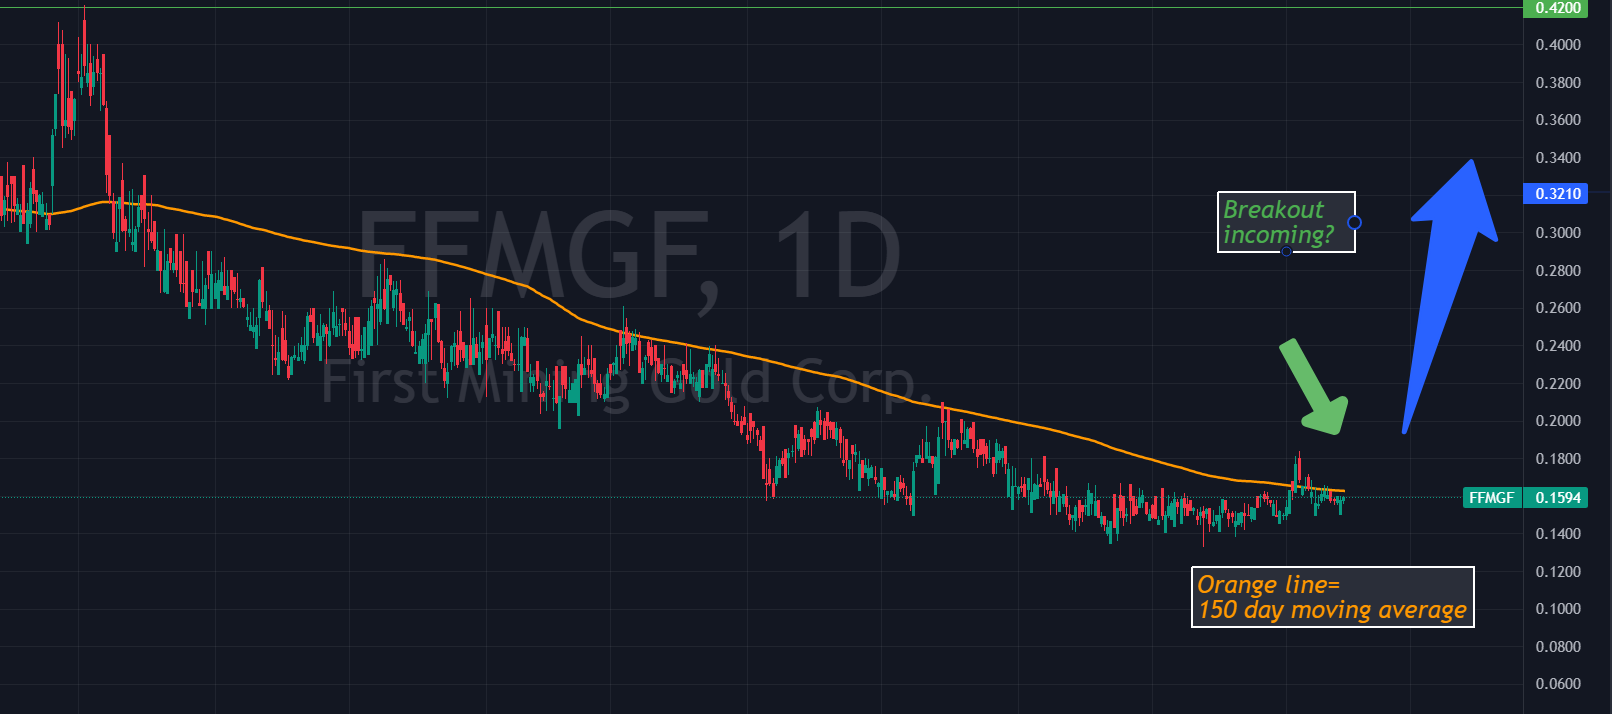
So is FFMGF a Buy?
If you believe history will repeat, like I do, why not wait for price to break above the 150 day moving average on good volume like it did in May of 2020?
Will it be THE bottom? No…but you’re more likely to be on the boat with buyers at that point. At this point those buyers haven’t announced themselves yet.
Price breaking above this moving average indicates momentum. Go with the flow, not before the flow.
I’ll finish with one last chart.
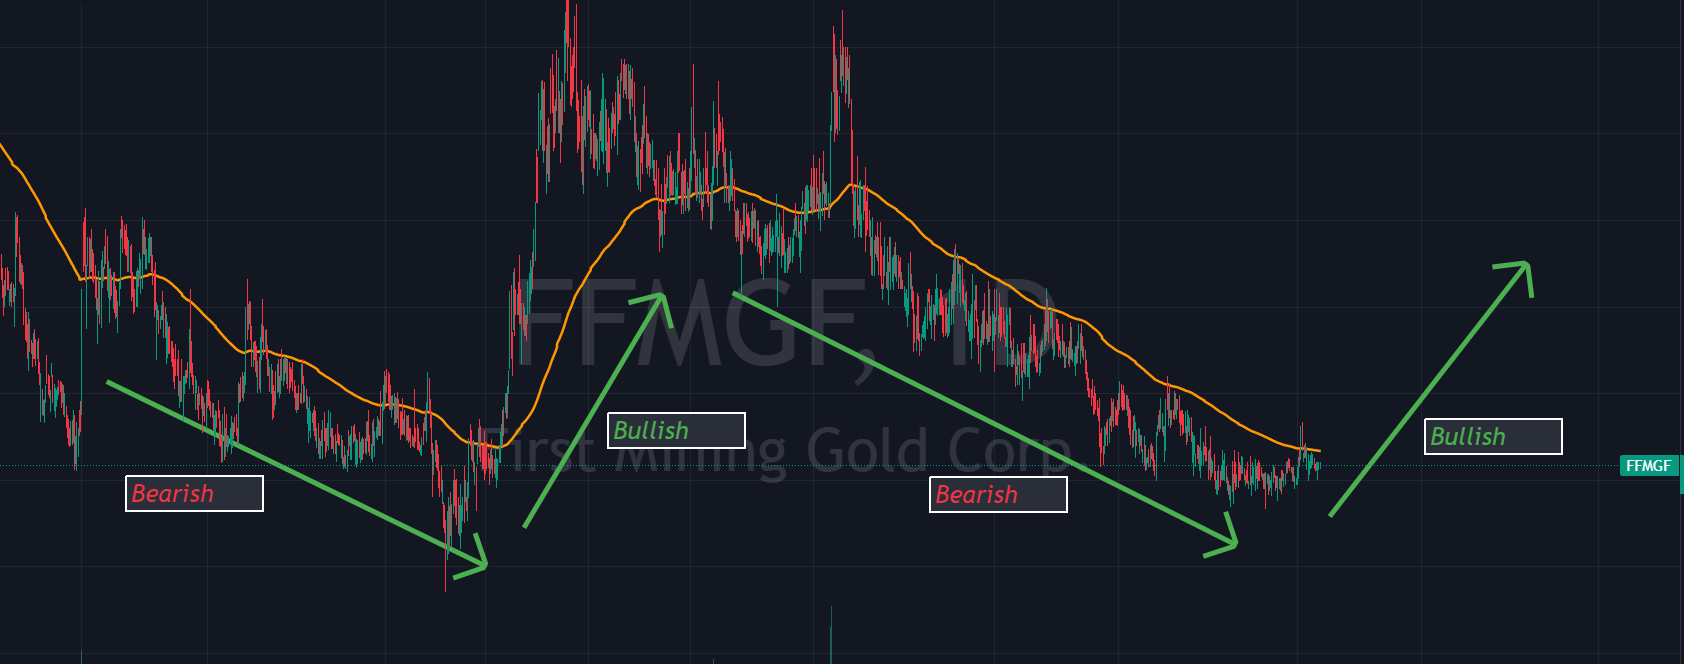
Market cycles. The chart below illustrates this. This three year chart of FFMGF shows clear trends.
Bearish to bullish to bearish to…?
When looking at the chart below and using the 150 day moving average in orange…it appears to be curling up, indicating a possible trend change again.
This is where YOU decide.
When it comes to investing, there are no certainties. Only probabilities. Nobody rings a bell at the bottom or the top.
However, charts will leave you breadcrumbs…
My eye sees breadcrumbs in these charts.
My thoughts and my thoughts only. Not investment advice. I am not saying to go buy this stock today…this is meant as an example of how technical analysis can guide you.
Thanks for reading.
Eric