


I Know Absolutely Nothing About Aluminum
However, this might be a reason to buy this aluminum producer now

Welcome back everyone,
First let me start by saying I know absolutely nothing about aluminum. However, what I do know are charts. And this chart stood out to me like a sore thumb…in a good way. Because of this, I thought I’d peruse the fundamentals, seasonality, etc.
I am not an expert in aluminum, nor is this meant to be investment advice. This is for entertainment purposes only.
So let’s talk about aluminum in eight charts.
More specifically, let’s talk about Century Aluminum Company, a $1 billion aluminum producer based out of Chicago.
CENX - Century Aluminum Company 👇


1️⃣ First, fundamentals:
🎯 Earnings reported last Thursday were better than expected, a surprise to the upside by almost 50%. The last six quarterly earnings reports were also better than expected.
🎯 Plus, revenue, earnings, and profit margin have been improving year over year. 👇

🎯 Technicals and Analyst ratings are both “Buy”, according to my research. However, I take analysts ‘buy’ ratings with a grain of salt. Just like you should with me. Technicals, on the other hand, are what I really lean into.

So, fundamentally speaking on a very basic level, CENX appears to be doing well.
2️⃣ Technicals
Weekly Chart 👇
I looked deeper into the technicals and on the weekly chart noticed that each up thrust in price leading to a top was 1) after a consolidation period and 2) in and around the month of March.
Each intermediate top was preceded from a level along the yellow support line.
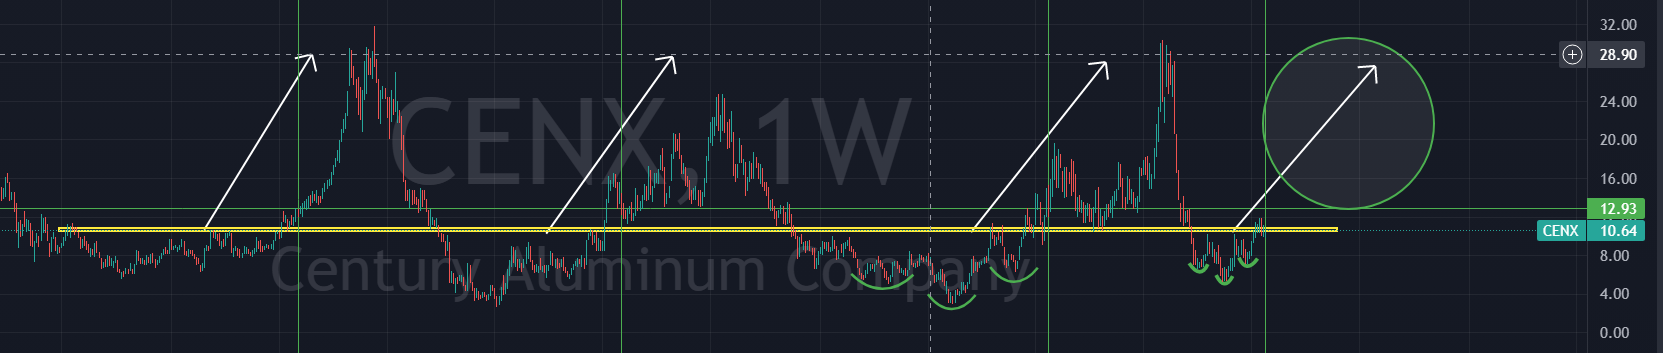
Where are we now?
Well, we are entering the month of March and we have been in a consolidation period for the last couple months…AT THE YELLOW SUPPORT LINE.

Why March? It may be nothing but…

…when it comes to March and April, aluminum appears to do well. Now to be fair, I don’t put a whole lot of weight into seasonality but it is one more confluence of data that points in favor of rising aluminum prices.
Let’s keep going…
The 150 day moving average in orange is also telling a story. Trend has reversed from a downtrend to a now rising. Price is looking to either re-test in the area of that moving average…or time will allow this rising moving average to catch up to price. Either action should be a catalyst to send price higher.

I’m not done yet…
Inverse head and shoulder? 👇 Yup…bullish.
The Inverse Head-And-Shoulder pattern is an example of a bullish reversal pattern and often shows up at the BOTTOM of a move.
But MOST importantly in my technical view is the fact that prior resistance (just below the yellow line) how now become support.
I’ll repeat that last part…
…has now become support.
Support. Floor. Not resistance. Potential to move higher. Has legs. In fact, if you look at the last candle, it actually looks like it has legs. Lol.
You get the idea.

Summary:
I’m a buyer here.


Okay, that was fun. Now remember, this was meant for entertainment purposes only so I hope you were entertained. I am not a financial advisor, nor do I play one on Substack. I’m an entertainer…but not in the traditional sense like a dancer of some kind. More of a Substack entertainer.
Hopefully.
Okay, now I’ll stop. Hope you were entertained.
If you know of anyone who might also like to be entertained in the future, please share The Tobin Report.
Thanks for reading.
Eric,
The Entertainer.