Good morning everyone! Thanks for being here. 😀 Everything money, markets, and charts. I hope everyone had a good 4th of July weekend.
…now let’s get to work.
In this report:
a few charts
Inflation views from Federal Reserve - more rate hikes?
Impact on gold & gold equities
2-year bond yield nearing 5% - what happened in 2008
Breakout imminent in this commodity
Cool Photo
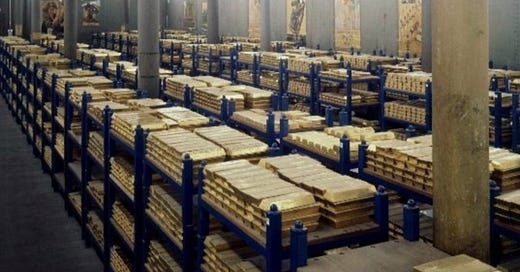
🔶 France has the 4th largest gold reserves at 2,436 tonnes!👇
Fed & Rate Hikes
Recent messaging from world central bank leaders this past week was a bit scary. For one, Fed Chairman Jerome Powell and his peers admitted they don’t understand what is happening right now in their battle with sticky inflation.
Inflation is not just a U.S. problem, but also a global one. Nearly every major economy around the world is fighting significant price increases due to
the effects of the Covid-19 pandemic
global supply-chain disruptions
unprecedented stimulus measures
Russia's on-going war in Ukraine
the EV transition
the global energy crisis
Not a single policymaker expects inflation to fall back to their 2% target in the next 12-24 months, strengthening the case to continue hiking rates at upcoming policy meetings in July and September and potentially all the way through until December.
After being asked when inflation will return to the 2% target during a meeting this week, Powell straight up said it won’t happen before 2025.
2025!!
But current economic and financial market conditions cannot handle anymore rate hikes, so I still anticipate that the Fed's acceleration in interest rates will ultimately catch up with them - leading to a reversal in policy in the coming months.
But I could be wrong.
500 basis points of rate hikes from the Fed over the past 14 months have already pushed mortgage rates up by more than double.
Credit card debt has surpassed $1 trillion for the first time ever, while bankruptcy filings are at their highest level since 2008 - and I know you know what happened in 2008.
The higher rates go, the bigger risk of the global economy cracking. With the 2-year Treasury yield already back up to 4.9% and rising, we may see more bank failures as soon as we reach 5%.
What is the significance of 5% on the 2-year yield?
The rise to 5% during the 2008 rate-hike cycle created a global banking crisis (we all remember), and again during the current hiking cycle, causing the regional U.S. banking crisis earlier this year. We saw the collapse of four banks when the 2-year yield rose to 5% again into March, including the second and third-largest bank failures in U.S. history. Well, we are rapidly approaching the 5% yield once again.
What will break next and when?
Below is the monthly chart of the 2-yr bond yield showing the rise in 2007-2008 and subsequent collapse. Here we are in 2023 again. What next?
Impact on GOLD
And what happened to gold in 2007 - 2008 after the 2-yr peaked at 5%?
UP 🆙 🚀
The yellow circle in the chart below coincides with the yellow circle on the left in the chart above.
Gold Equities
What about gold equities?
Iam Gold Corporation (IAG) is just one example of what happened to the whole sector. 10X gains in MANY companies that produce gold, explore for gold, and build mines.
Gold Moving Forward
While more rate hikes are on the table moving forward which would put short term pressure on gold, the longer view is MUCH, MUCH higher. Gold investors such as me are looking beyond the rate hikes to the day when the Fed stops raising and eventually cuts rates.
The full impact of the situation in Russia remains uncertain, while a reaction could still come as we head into the second half of 2023.
Given the current oversold conditions in the precious metals market and rising bearish sentiment, we may have seen the low this last week at $1900 in Gold Futures which could be the start of a summer rebound.
Another Fun Chart - Silver
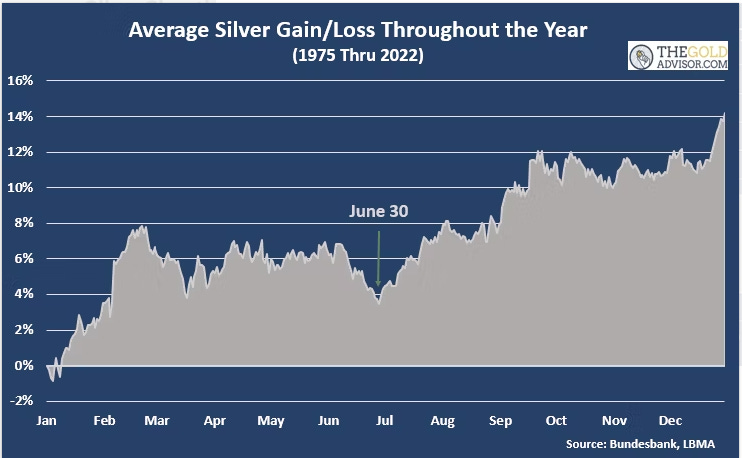
Since 1975, June 30th has been THE low for the year in the silver price. This chart takes in the average silver price gains/losses for the past 47 years. Courtesy of Jeff Clark, The Gold Advisor.
More Fun With Charts
Federal debt. Not good for the dollar.
Lastly, a Breakout on the Horizon…👇
Keep reading with a 7-day free trial
Subscribe to The Tobin Report to keep reading this post and get 7 days of free access to the full post archives.


