


Joby Aviation (JOBY) - Golden Cross
Brief discussion on JOBY - time to buy or wait for a pullback?


A friend recently asked me about a stock he owns and he mentioned the “golden cross”, which, for those who don’t know, is a technical indicator signaling a bullish move.
The question is…
Do I buy now or wait for the pullback?

But before I get into the implications of a golden cross, here is the company he was referring to:


Joby Aviation, Inc. is a transportation company developing an all-electric, vertical take-off and landing aircraft that it intends to operate as a commercial passenger aircraft beginning in 2024.
It’s like UBER but way cooler.

That said, ‘way cooler’ doesn’t mean it’s a great investment. After all, they aren’t making money yet, they continue to dilute shareholders, and they operate in California where permits and taxes are always a headwind.
But the potential is there.
Market capitalization is $3.7B with average daily traded volume of 2.3 million shares.
So now that you know a little bit about the company (not much, sorry, I focus more on technicals)….
Let’s get into what the technicals are telling us and what the hell a ‘Golden Cross” means.
What Is a Golden Cross?
A golden cross is a chart pattern where a short-term moving average crosses above a long-term moving average. This is typically the 50-day crossing ABOVE the 200-day.
See the chart below:
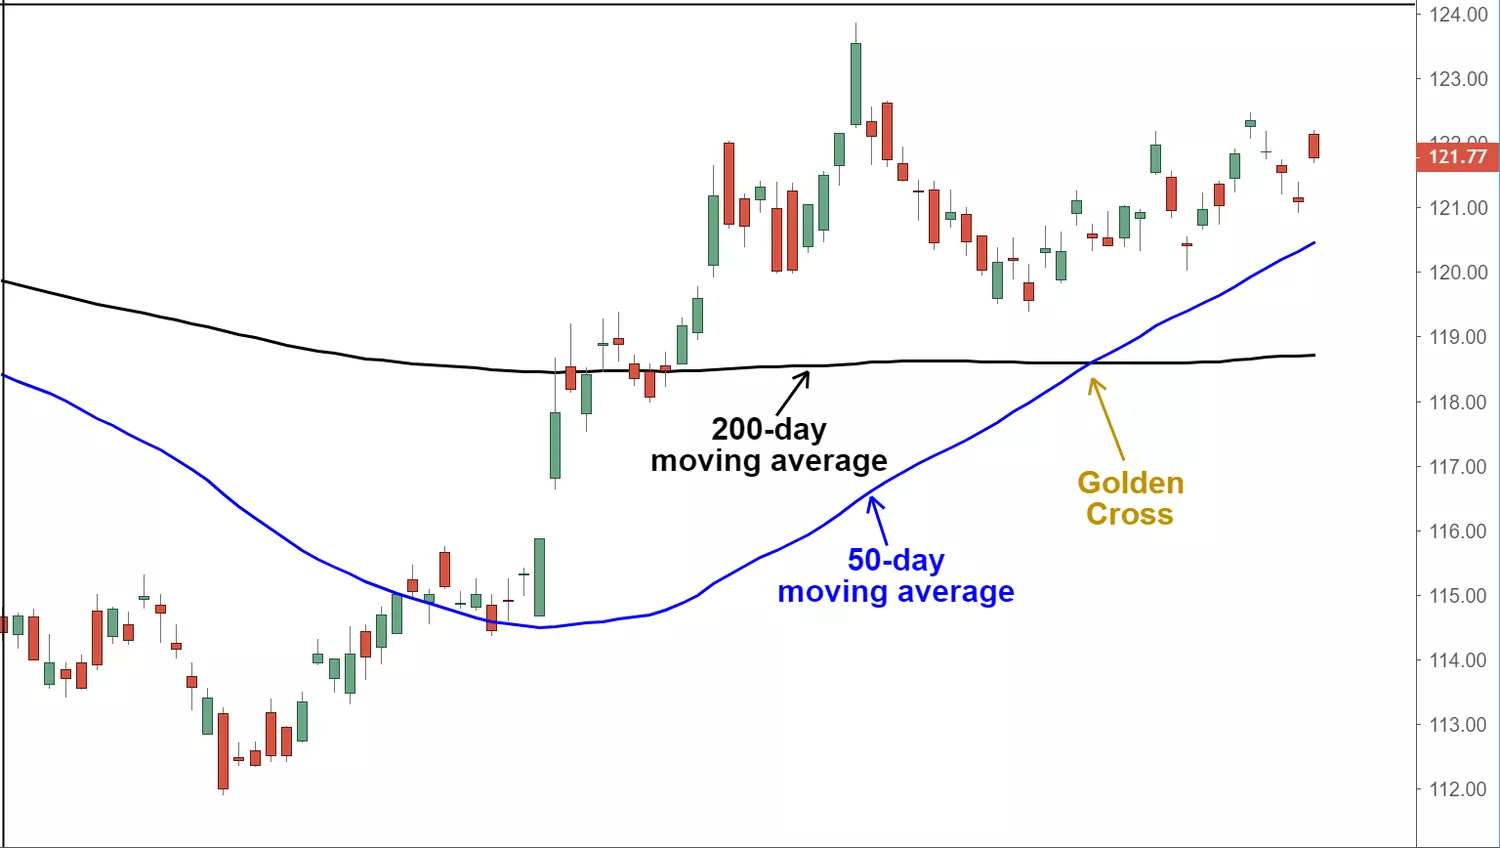
What Does a Golden Cross Tell You?
The golden cross indicates a bull market on the horizon and is reinforced by high trading volumes. Volumes are CRITICAL.
There are three stages to a golden cross.
1️⃣ The first stage requires that a downtrend eventually bottoms out as selling is depleted.
2️⃣ In the second stage, the 50-day moving average forms a crossover up through the 200-day moving average to trigger a breakout and confirmation of trend reversal.
3️⃣ The last stage is the continuing uptrend for the follow through to higher prices.
The moving averages act as support levels on pullbacks until they crossover back down at which point a death cross may form.
The death cross is the opposite of the golden cross as the shorter moving average forms a crossover down through the longer moving average.
So let’s look at JOBY
Yellow line = 200 day moving average; Blue line = 50 day moving average
Clear downtrend ✅
Bottom made, trend reversal, 50 day just starting to cross over the 200 day. ✅
Price follow through ✅
BULLISH

But that doesn’t mean we just dive in and buy. Timing is everything. And are the volumes there?
Let’s look closer…
Price has run HOT and coming into some resistance. Prior buyers from last year are excited they are finally at a breakeven point and will sell. They are happy to no longer be at a loss (market psychology is real).
This creates a pullback. A pullback to where?
Great question. Glad I asked.
Let’s use the next chart, below. Same chart, just zoomed in.
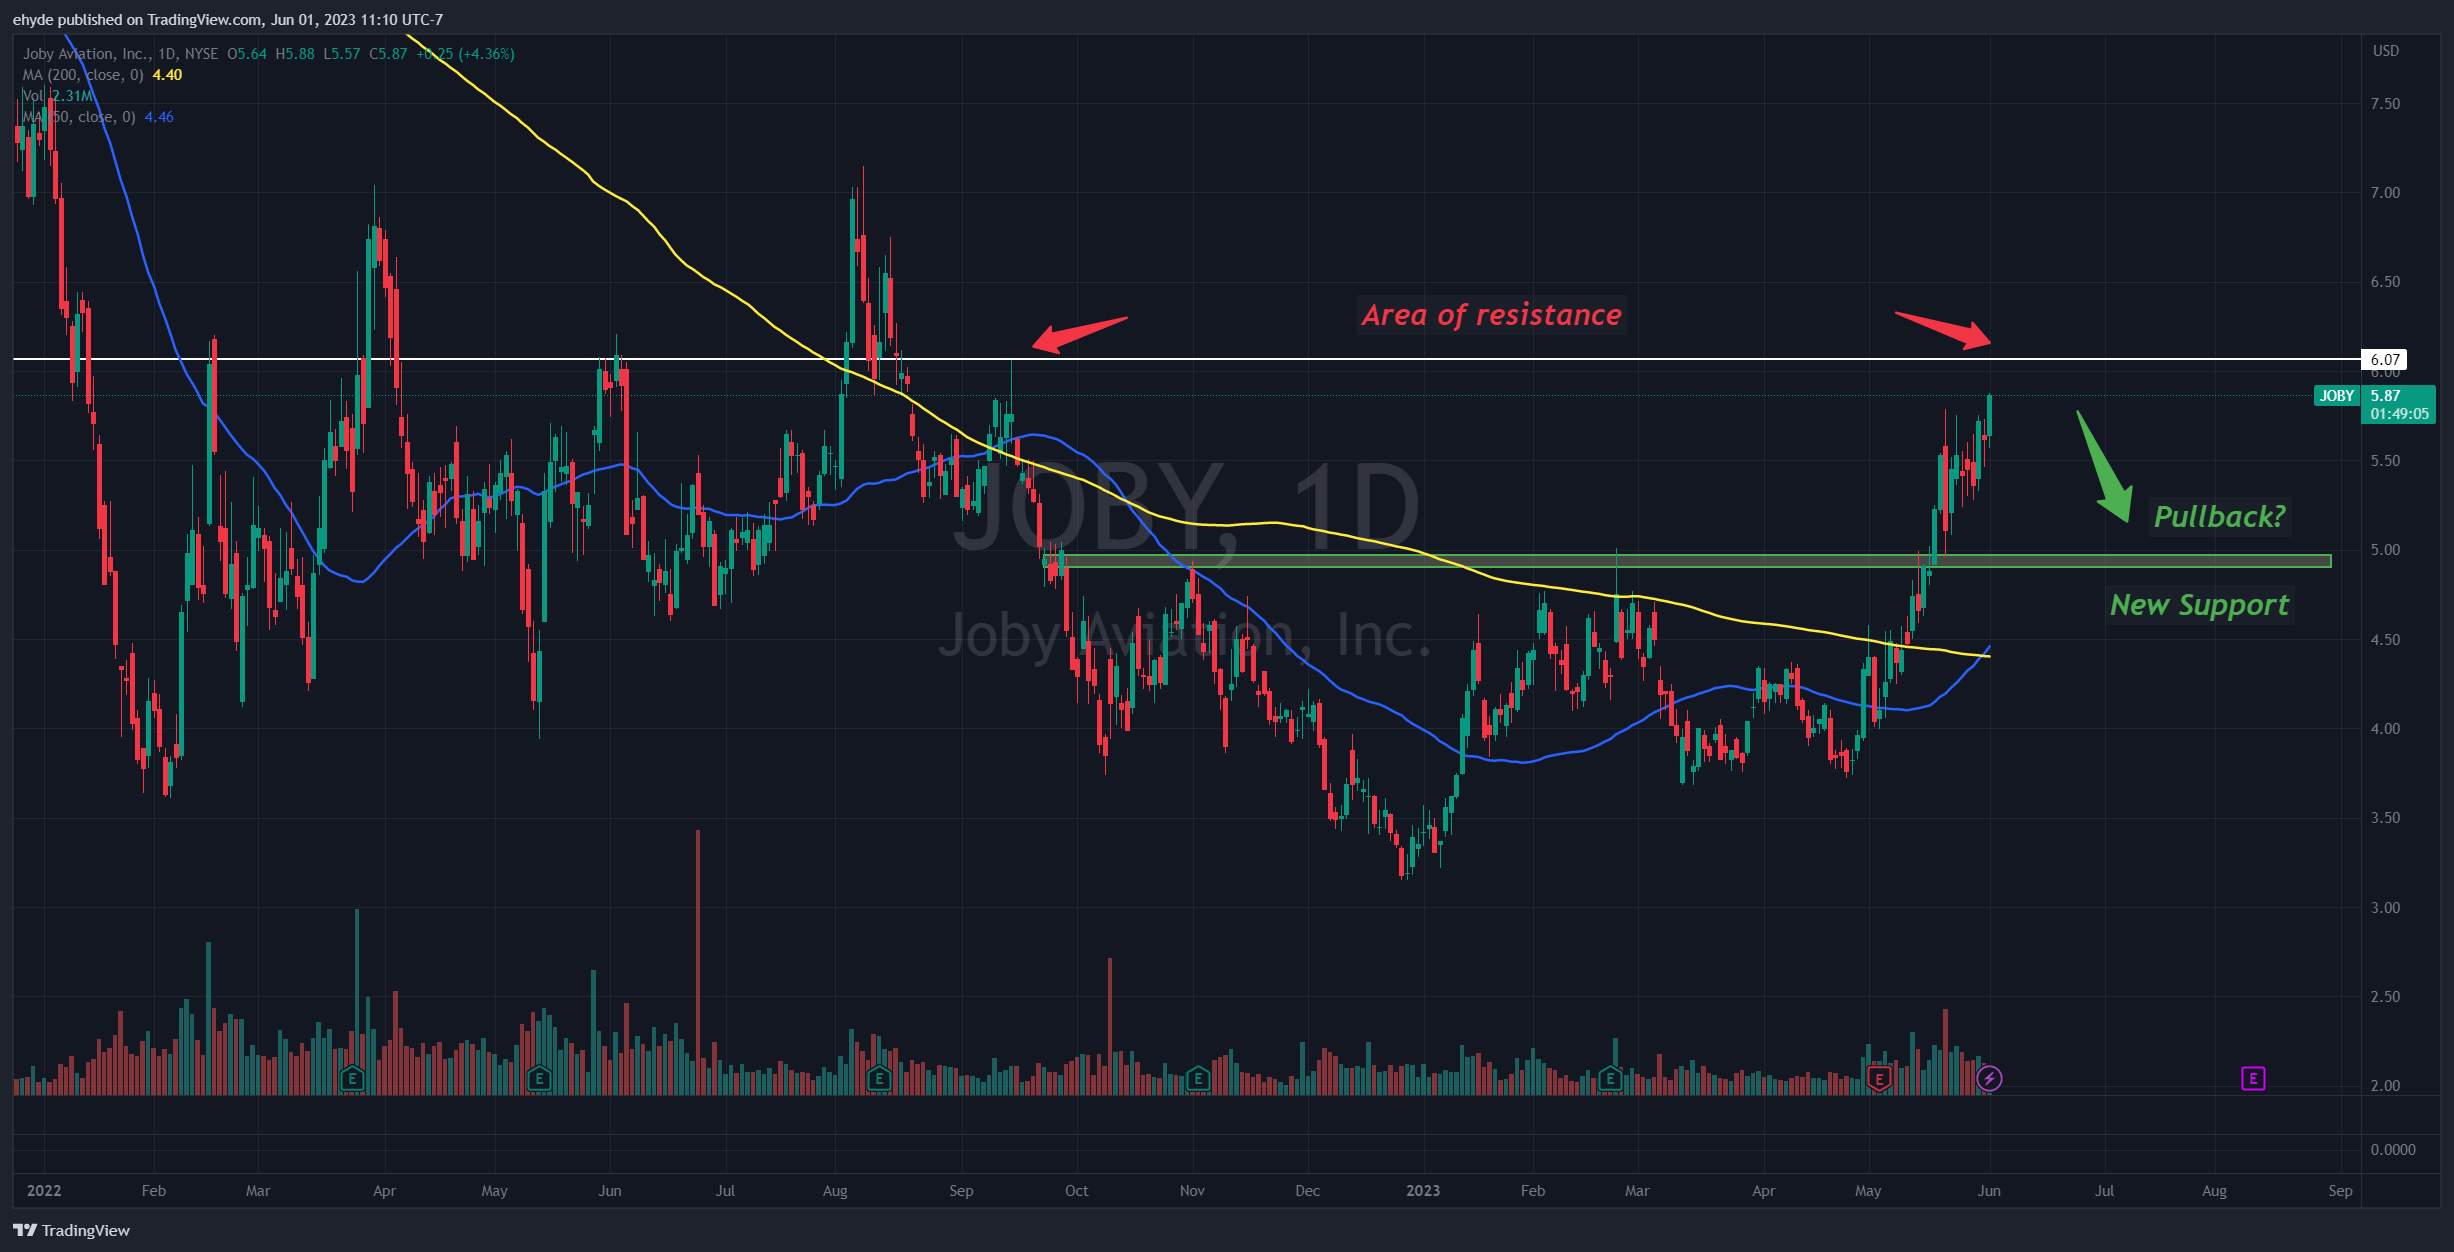
Prior resistance (thin green rectangle) now becomes support. If JOBY pulls back to this green support area…..
THIS IS THE TIME TO BUY!
I’ll say it again……If JOBY pulls back to the green support area….THIS IS THE TIME TO BUY!
Very rarely does price NOT pullback after a big run. Price always reverts to the mean. This is why moving averages are so important…they represent the mean for that given timeframe. Whenever price overshoots it’s moving average, like it did here, a reversion to the mean typically follows.
Once the pullback occurs, look for support at the appropriate moving average…most likely the 50 day in blue. As the 50 day is rising day after day, a likely scenario is it runs up to that ‘new support’ zone where price will have come down.
That’s my entry point if I don’t already own…or where I add if I do own.
Two caveats:
1. I’m not seeing huge volumes like I want to see.
2. Price could very easily run a bit higher, even up to $7 before it corrects. The $6 area is likely, but $7 is possible.
There you have it. JOBY.
Not financial advice. Education and entertainment only.
Click the link below to check out their website:
We’ll talk soon.
Eric