Global Liquidity
I’ll let this chart do most of the talking. 👇🏽
Liquidity drives markets.
Is there any reason to doubt that we will have more liquidity?
With election season here and the Fed cutting rates, there should be no doubt in your mind we are looking at INCREASED liquidity, both globally and in the U.S. This is an easy one. Stocks, commodities UP.
If you’re invested in the market, your account has been GREEN these last few weeks. HUGE. If you’ve been in uranium, gold and silver…..your account has been on fire! 🔥
Gold is soaring because the U.S. national debt just added $500 billion in the last three weeks, and it now stands at just under $36 trillion. Gold miners are the second-best performing equity sector of the year, up 34% YTD.
Bitcoin appears to be breaking out of a year-long wedge pattern and waiting to launch with the next round of fiat money printing.
Uranium miners (URA) are EXPLODING as a result of big tech companies announcing their need for uranium to power AI. URA is up 50% in ONE MONTH from the lows. For those of us who had the conviction to buy when uranium was in the trash, congratulations!
Amazon Invests $500M in Uranium, Boosting Green Energy
Amazon just backed an investment in X-Energy, the privately held peer of NuScale Power (SMR). SMR is up over 150% in over a month. The uranium theme is pervasive throughout markets. This began when Microsoft announced the partnership with Three Mile Island. I’ve said many times and I’ll say it again, the uranium investing theme might be one of the greatest investing opportunities of my lifetime. And we got in low. We’ve been riding the volatility, which is not easy but when you’ve done the research like I have, you have conviction to add on drawdowns. Most panic out and buy AFTER the move up.
For those already invested in uranium, HOLD ON! For those not yet involved, it’s important to find the right entry point. Monday morning after last week’s runup in price is probably NOT the time to get in. Be patient. This is a multiyear bull market that will have MANY buying opportunities, i.e. huge drawdowns. It is currently technically overbought on shorter timeframes.
BUT, I see the opportunity greater in uranium miners over the metal itself. With all the new investment in nuclear power to drive AI computing, we're seeing the miners catch up HUGE, relative to the underlying metal.
Below is a ratio chart of uranium miners (URA) verses the price of uranium (U.UN or SRUUF). You can see the down trend over the last year with a recent breakout from the descending wedge. Classic breakout which indicates that mining companies will outperforming the metal.
Uranium Miners - One Week’s Gains
Cameco +13%
Dennison +24%
Nexgen +17%
Uranium Energy Corp +20%
Energy Fuels +25%
In any trade, there is always a time when you are tested. Uranium might be the most volatile trade I know (well, uranium AND silver, actually). This is where conviction comes in.
If you have conviction in your thesis because you’ve done your research, you will stick with the trade.
If you have conviction, you can add to the trade on drawdowns. If you are early and catch a multi-year secular trend in the first inning, you don’t want to panic sell at the bottom of the second inning. Stick with the trade if nothing fundamentally has changed. Uranium. Is. Going. Higher.
In a straight line with gains every day and every week? Not even close.
CHARTS
Okay, enough about all of that. Let’s get into some charts. Let’s get into some beautiful charts poised to make great money.
PBF Energy - PBF
Two Charts
Downtrend broken. Sellers appear to have disappeared.
Wait for some buyers to show up.
50 day moving average (blue line) curling with price peeking above
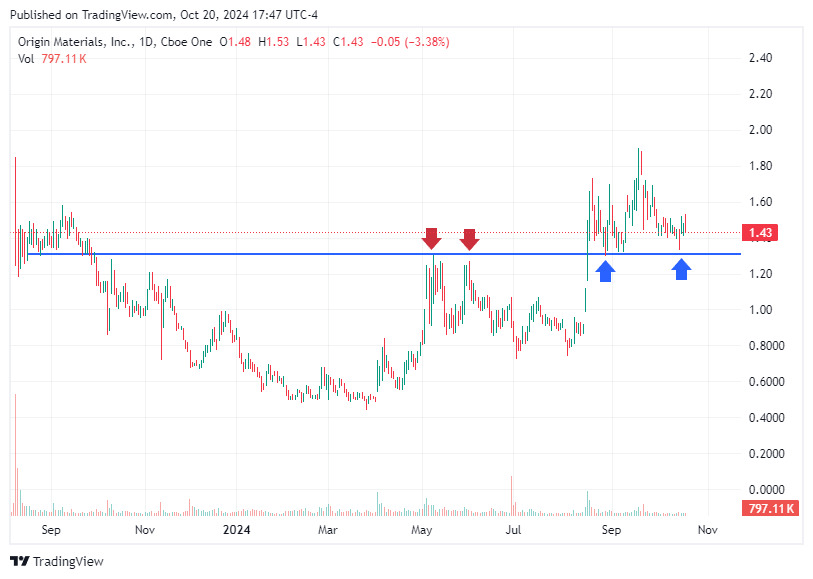
Origin Materials - ORGN
Longer term shows this chart broken down (not pictured here) - this is not a long term hold
Clear resistance and support area - red and blue arrows
Speculative buy with a short leash, stop loss if it breaks below floor (blue line)
Zebra Technologies - ZBRA
Bearish to bullish turn
150 day moving average (blue line); price riding it up
Is it a buy HERE? (next chart)
Same chart, zoomed in a bit
Clear, obvious trendline acting as support
Wait for test of support, add when price proves it as support once again
Get out if price breaks below.
There ya go. A few charts for fun.
Thanks for reading,
Eric


