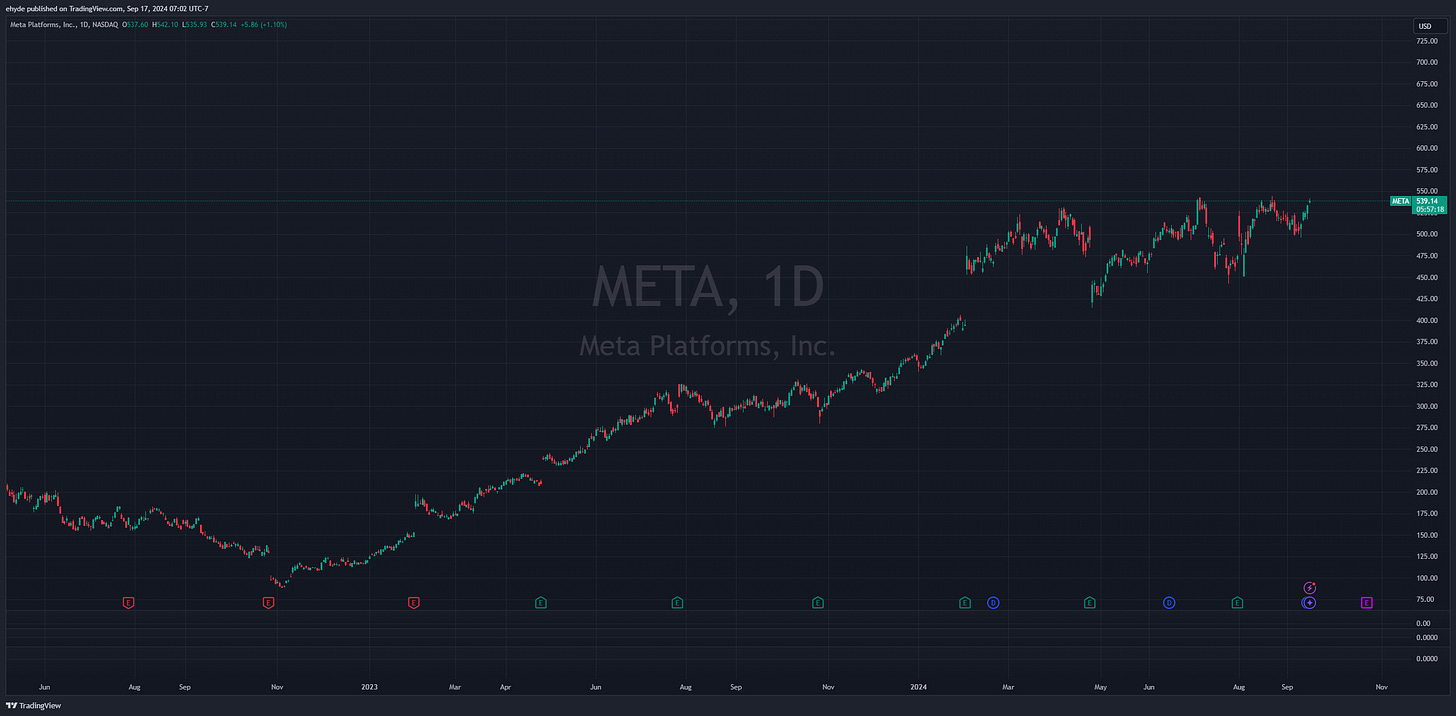
META - Is a Breakout Imminent?
META wants to breakout.
Welcome back to The Tobin Report.
Last week I wrote about technical analysis and how chart patterns repeat over and over. You can find similar chart patterns everywhere in markets. Well, I just found two that look almost identical. One is NVDA that tripled in value over the following months. The other is setting up in the same pattern.
Will META follow the charts like NVDA?
I’m not predicting this…but I am pointing out the pattern and possibility of a breakout.
META in two charts.
1️⃣ Daily chart of META going back two years. No bias in the chart. Trend is up with a consolidation phase coiling.
Price sitting at $538 as I write this.
2️⃣ Same chart of META but this time with a bias. Possible breakout imminent. IF price breaks above yellow resistance line, expect a breakout. If price gets rejected from resistance, expect continued consolidation within the yellow wedge.
It’s that simple.
NVDA
Now let’s look at NVDA just before the insane breakout. This setup looks eerily similar!
👇🏽
This does NOT mean META will do the same as NVDA…but the chart is telling you price is ready to make a move one way or another.
That’s all for today.
Eric


