My Favorite Time to Buy
Three stages of a reversal: the selloff, consolidation and the turn. Plus I'll give you several charts on my watchlist.
Many stocks are cyclical and follow patterns linked to broader economic cycles. For example, they do poorly when financial conditions are tight and the economy is in a contracting phase. When financial conditions loosen, they consolidate and turn. I like to find these consolidations and wait for the turn. Or better yet, I like to find the beginning of the turn and BUY.
But it’s important to understand the chart patterns and different stages: the selloff, the consolidation, and then finally the turn.
Three Stages of a Reversal
Sell Off or Downtrend - First, wait for the selling to stop. A stock that sells off might be considered ‘on sale’ but how do you know when to step in and buy? Many traders will ‘DCA’ or dollar cost average by adding more money to a losing trade but how do you know when the bottom is in? In order to avoid catching a falling knife, it’s important to find clues that the sellers have stepped aside.
Consolidation - The consolidation phase is the first step indicating that the sellers have moved along. This is when the stock is no longer going down…it’s consolidating and forming a support area or base. This is fairly obvious on the chart. Buyers have stepped in and there is a battle between buyers and sellers. This could be an area to step in and buy but understand you could be a bit early. At least you know the major selling has subsided. I tend to wait for confirmation that consolidation is over and the stock is ready to move UP.
Turn - It takes patience to get here. You may miss the exact bottom but you will avoid catching a falling knife. The battle of buyers and sellers has exhausted and price is being supported by moving averages. This is where I like to enter into a bullish trend…higher highs and higher lows. Price moves and holds above moving averages. Trend has changed. More buyers than seller…and you jump in with the other buyers.
This is when it’s time to ADD on dips on the way up.
Pullbacks are healthy and necessary in this phase.
This is the best risk/reward phase.
Long story short, I look for BEARISH to BULLISH reversals. A bearish trend that has consolidated and turned bullish. These are intermediate to longer term trends that can take months to develop and after the consolidation has completed, can last years in the new bullish trend.
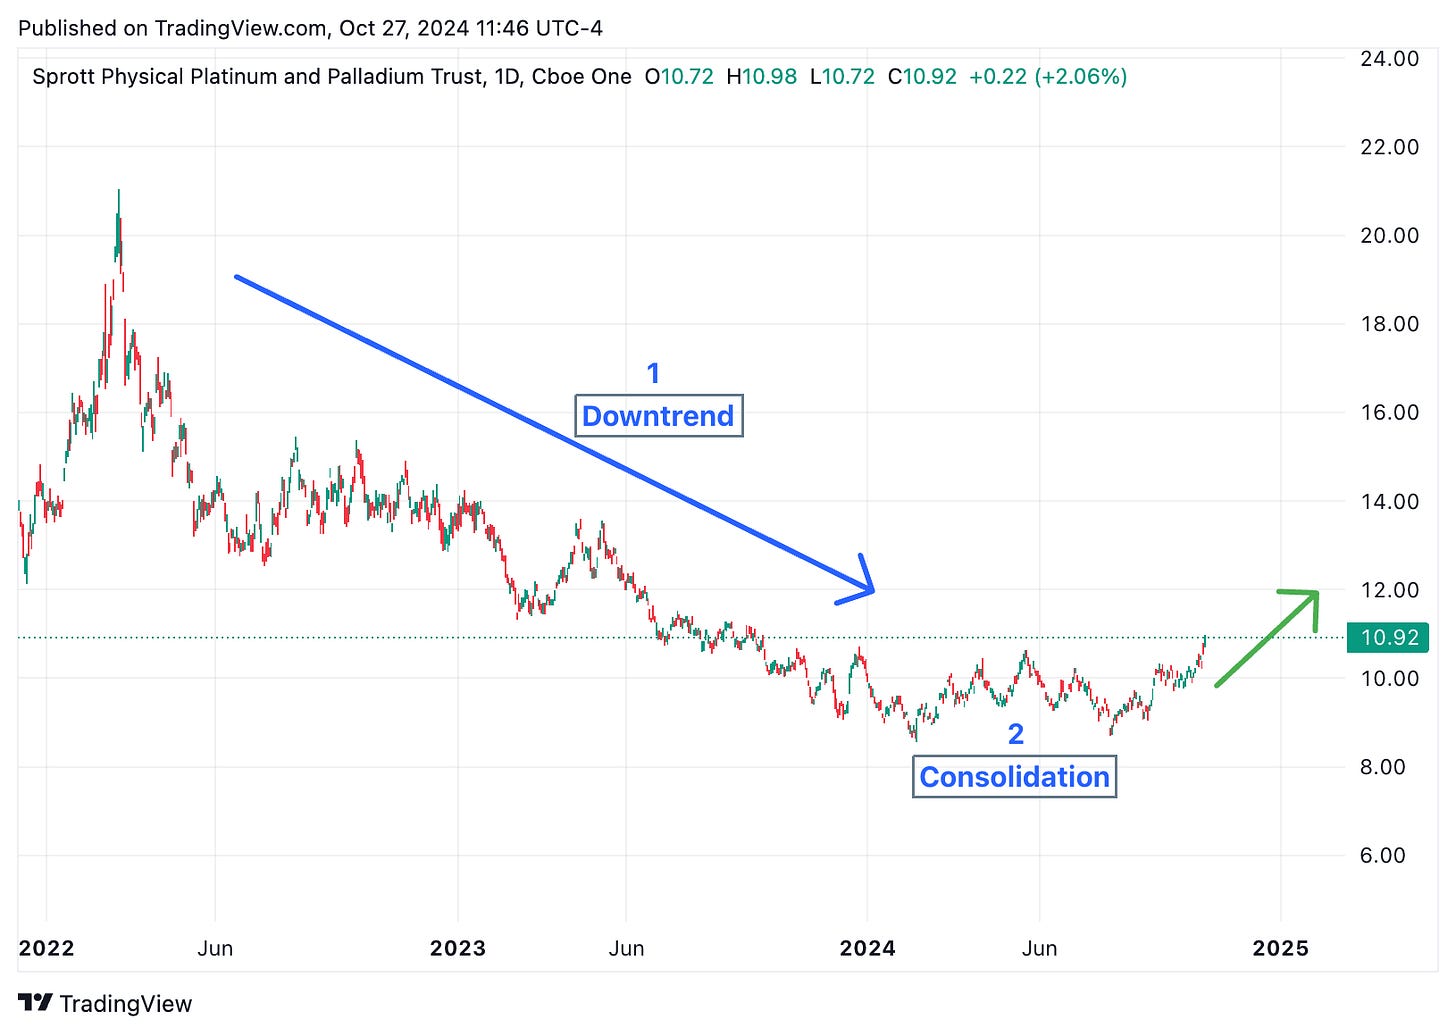
Let’s look at one that appears to be taking shape right now….
Sprott Physical Platinum and Palladium Trust - SPPP
Long, 2-year downtrend with price cut in half
Consolidation and base formation
Let’s zoom in a bit…
Bearish to bullish reversal - 150 day moving average (orange line)
Double bottom (green arrows) - price marks a low then retests the low as confirmation
Price moving higher, making higher high and higher lows and NOW on 150 day moving average support (blue arrow)
I’m a buyer of Sprott Physical Platinum and Palladium Trust for my retirement account for the next couple years.
Now that you can see the concept behind the Bearish to Bullish reversal patterns, let’s roll through a few others that look good.
Four Stock Charts on My Radar 📡
Keep reading with a 7-day free trial
Subscribe to The Tobin Report to keep reading this post and get 7 days of free access to the full post archives.


