

New Trade Setups
I will be taking a week off the 'Building Your Wealth" series to put out a few trade setups...

I’ll start by reminding you:
You know how I feel about commodities.

Crude Oil and natural gas are two of the most important energy commodities in the world. If you are paying attention to the world right now, you know we are in a global crisis with demand well in excess of available supply…and this does not appear to be getting any better.
Wait until China opens up…
I’ll leave it at that and get to my trades for the week.

Oil & Gas
Antero Resources Corporation (AR)
Antero is an oil and gas company with a market cap of almost $11B.
Antero Resources Corporation is an independent oil and natural gas company engaged in the exploration, development, and production of natural gas and oil properties located in the Appalachian Basin. They are headquartered in Denver, Colorado.
Natural gas is known for its volatility. So when it comes to trading in this space, stop loss orders are a must! This will protect and limit your downside risk.
First, let’s look at the chart of natural gas, then we will look at the chart of Antero Resources.
Natural Gas
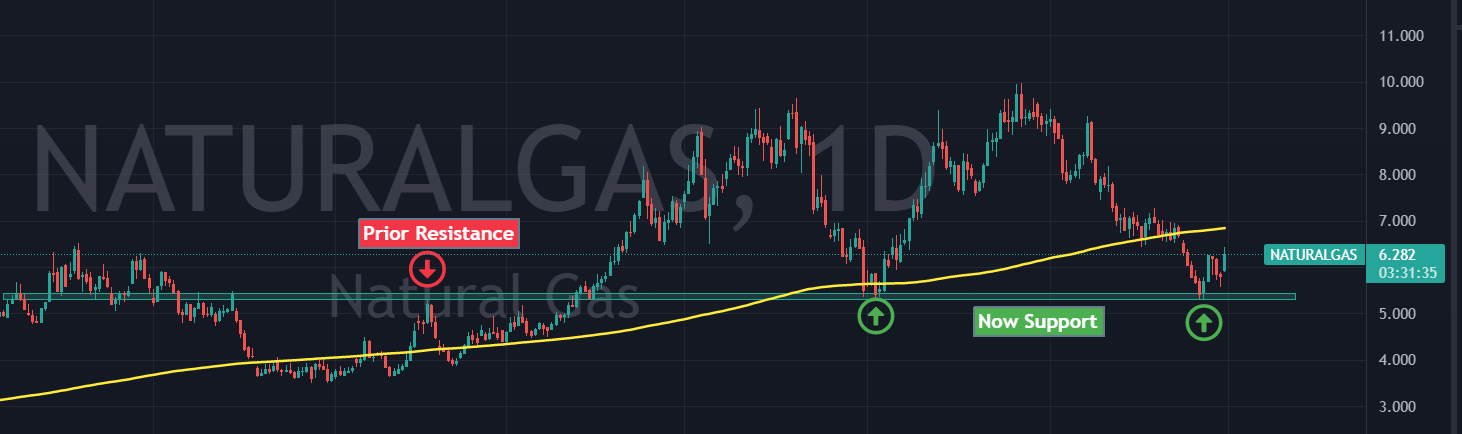
As you can see in the chart of natural gas above, we have prior resistance just above $5 (red arrow) where price tried to break above but was sharply rejected.
After it ultimately did break above this area, we have seen price retest this former resistance twice to give us a new floor…now support (green arrows). This is also known as a ‘double bottom’ with price bouncing higher.
However, caution should be warranted as we do have some overhead resistance with that rising 200 day moving average in yellow. And price is BELOW the moving average.
Do we break above or reject below? That remains to be seen, obviously. If price gets rejected at the 200DMA, next stop will be the area of support in green. If that breaks, I’m out.
If it holds…it proves once again this is GREAT support and will rocket higher.
▶ Now let’s look at the company that explores for and produces this commodity, Antero Resources.

What I like about this setup:
The trend is UP - rising 200 day moving average in yellow
Clearly defined down sloping wedge pattern (green line) - this has proven to be resistance at those levels. Probabilities favor a break above these setups.
IF you believe the price of natural gas is going up, then AR will likely follow suit as this is an exploration, development, and production company of natural gas (and oil)
▶ The trade (for illustrative purposes, not investment advice)
If AR trades down to the rising 200 day moving average, I’m a buyer.
Buy Zone: $32 - $34 area
Profit Zone: $48.80
If price breaks BELOW the rising 200 DMA, closer to the $31 level…and closes the following day below, I’m out.
So it’s important to see how it responds to that level.
STOP LOSS: if price drops below $31
💲 So you can see my risk is $1 to $3 while my reward is $15 - $17. I’ll take that all day long.
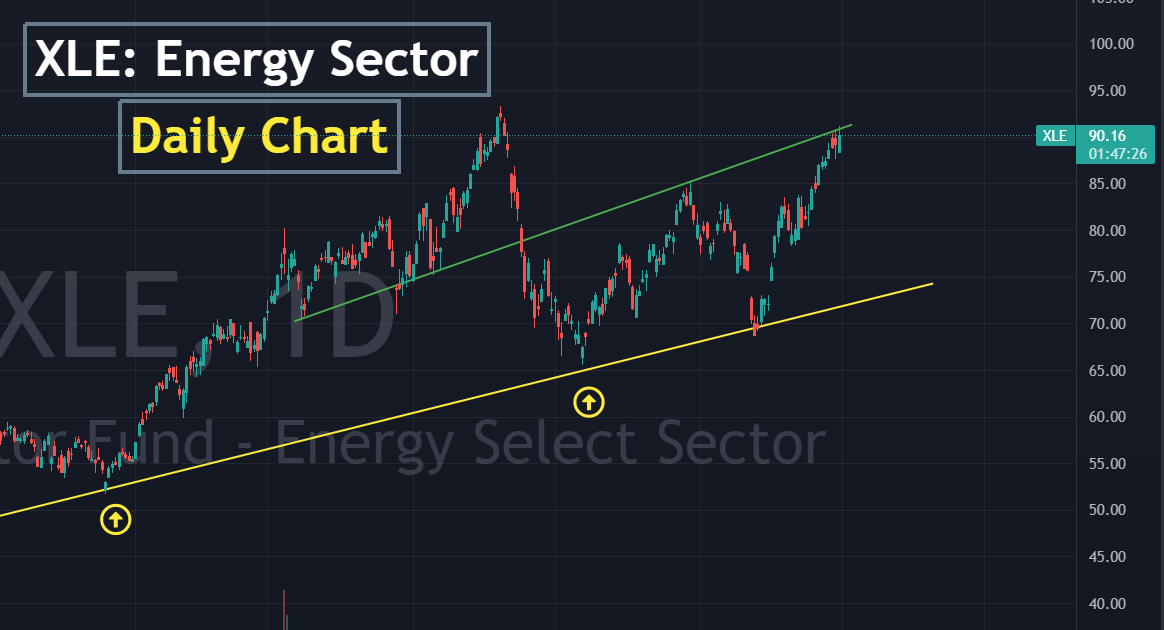
XLE - Energy Sector ETF
We’ve all heard about the cost of energy going up. This is likely to continue.
XLE is a basket of companies in the oil & gas, consumable fuel, energy equipment and services industries. This is an ETF, or exchange traded fun.

That said, these top ten holdings have done VERY well year to date. They will most likely pull back.
My trade on XLE is actually a “wait and see” trade. Meaning…I am not buying it yet. If you look at the chart of XLE below, you can see it has run up over 30% in a month.
Do I expect it to go higher. Absolutely.
Just not yet. It could run just a little higher into the $93 range before pulling back but I’m not good enough to be that tactical.
Short term, I am looking for a decent pullback in price. Price could actually pull back all the way to the rising trend line in yellow and still be in a bull market. This is what the chart is telling me.
In fact, I would be a MAJOR buyer at that level.
If I am wrong and price moves higher without me, no harm done. I’ll get it later. It WILL pull back at some point soon.
As you can see price is testing upper resistance in an up sloping trendline (green line). Plus, what you don’t see in the chart (I didn’t want to over complicate it) is a rising 50 day moving average sitting around $80…and price has stretched well above this.
Price always reverts to the mean, either by price dropping or price staying the same and time moving forward allowing the moving average to catch up.
This is all bullish…but I won’t chase price. If there is a pullback toward either the 50 day moving average (around $80-$81) or the prior pivot at the $85 range, I’m a potential buyer.
It all depends on what’s happening in the world.
PLUS…it’s an election year. Expect a shit-show in the news as politicians try to manipulate the price of oil lower to win votes. The Biden Administration can only deplete the reserves so far to keep prices lower before true price discovery occurs. (higher) Yes, this is happening.
Expect volatility.
That’s all for this week. Hope it was helpful.
Eric
PS - for those that reached out looking for help in calculating and tracking your net worth, thank you.
If you would like me to help you with calculating your net worth, I’m still doing this for free. You can even pick my brain on some investments.
For all you cops🚓👮♂️👮♀️ out there…still no charge! 💲💰
.