Oil - Two Charts
Oil is at a juncture. Break to the upside…or to the down side. Either way, we are close.
My bias is to the upside.
Let’s look at two charts and be done.
1 of 2 👇
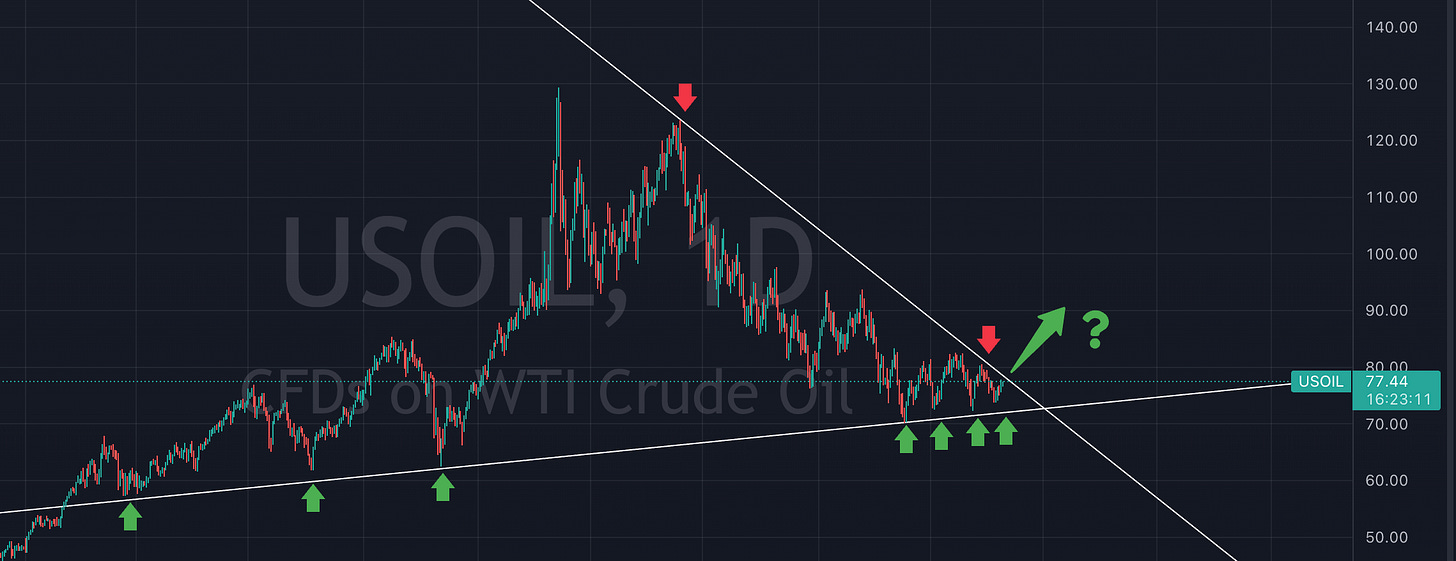
For two years oil has tested the up trend line to the PENNY (green arrows).
Price has touched the down trend line on two occasions (red arrows)
2 of 2 👇
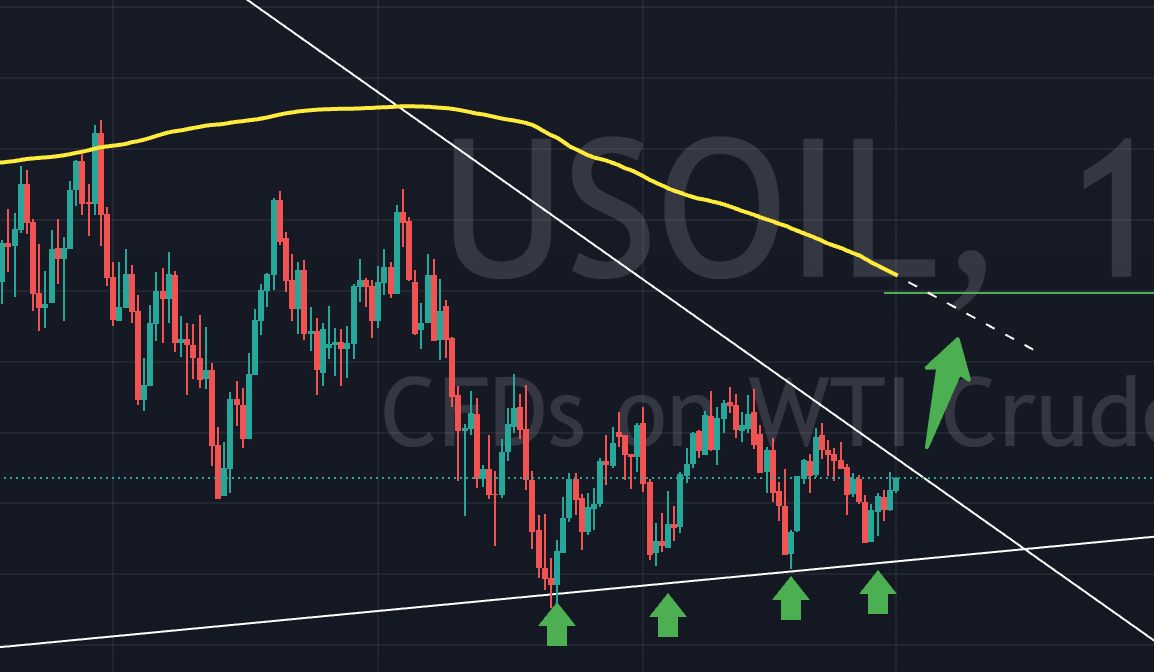
Zoom in. Add the 200 day moving average…price WANTS to break out.
Each low is slightly higher.
Could it break to the downside? Of course. However, the whisper I am getting says higher.
I’m a buyer.
My trade is USO.
Hope this helps.
Eric


Question, how does the 200 dma support the breakout thesis? Wouldn't the 200 dma act as resistance in this case?