Pfizer - PFE
I've been a buyer for my long term portfolio. The chart is telling me upside is likely moving forward. The 5.75% dividend doesn't hurt either. Let's look at four charts of Pfizer.
1️⃣ Weekly Chart - going back 13 years
Well defined support near $25 - $28
150 weekly moving average (orange line) - look how price moves away from it then returns to it, both to the upside and the downside = mean reversion
Price looks like it wants to return to its moving average once again
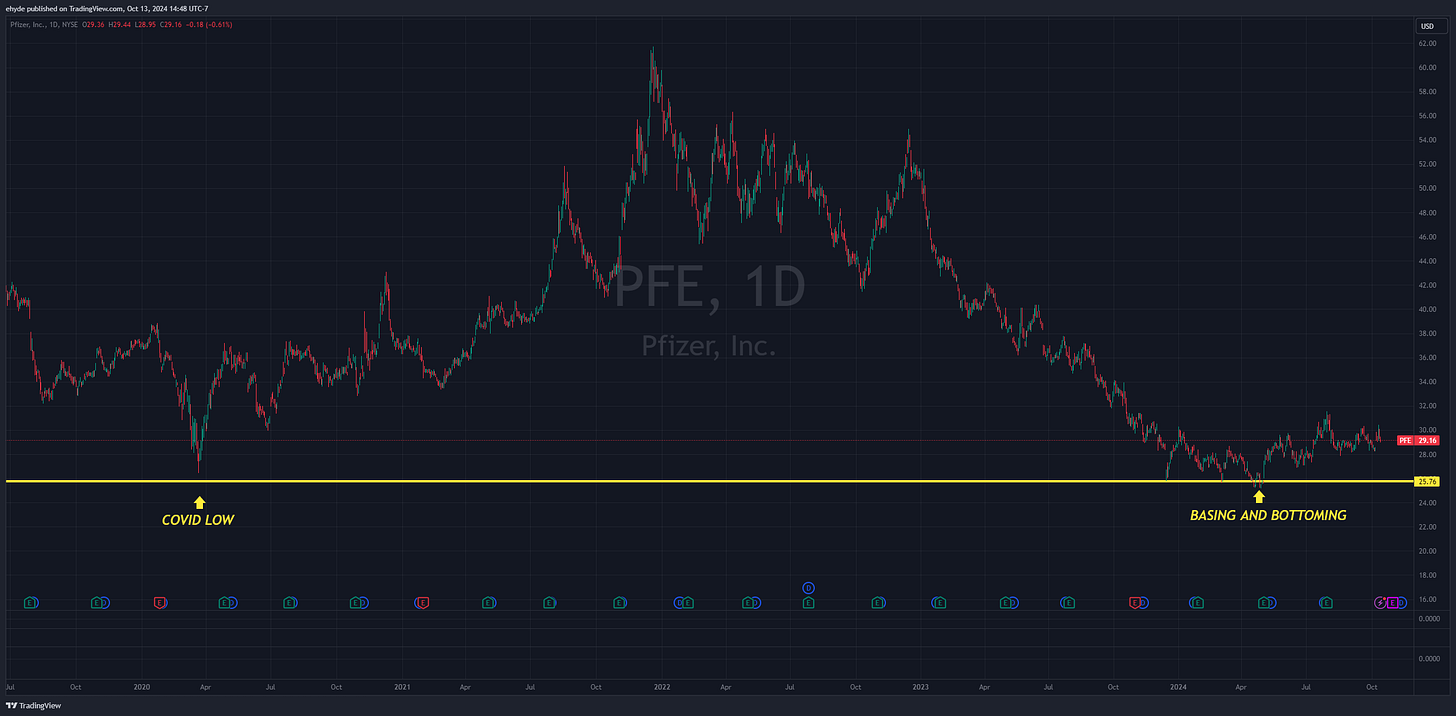
2️⃣ Daily Chart - going back just over 4 years
Covid low - March 2020
Price recently bottoming and basing at the same Covid low level
Zooming in a bit…
3️⃣ Daily Chart
Price bottomed in April, 2024
Price near the lower rail of the rising channel
Bullish price action intact
Look for upward price action to resume toward upper rail in the short term
Bearish to Bullish Reversal
4️⃣ Daily Chart - MY FAVORITE chart of the 4
Bearish trend reversing to form early stage bullish trend
Price previously below the 150 day moving average (orange line)
Price broke above and riding its 150 DMA perfectly
Look for price to confirm bullish price action by breaking above recent green candles
📜My Take:
I’m a buyer of PFE for what could be a longer term bull trend. I’m okay to add on some weakness but on a short leash of course. If price breaks below the rising channel, I’d get out or wait for further strength. It just so happens that the break below that rising channel would also be a break below the 150 day moving average, another signal to get out if that happens. That’s called RISK MANAGEMENT.
As long as price continues to show me this trend has turned from bearish to bullish, I’ll continue to add to my position.
BONUS: for those who choose to hold this position long term, you’ll be rewarded with a 5.75% dividend.
🎯 Price Target
HIGHER.
That’s all for now. Thanks for reading.
Eric


