The Imminent Trade
Let's check in on oil. I discussed it in February and after taking profits at key resistance, I'm looking at another level to enter again.
Hey all -
I’m making some improvements to The Tobin Report.
☘️ All TRADE ideas will still come to you the same way you normally receive them, but they will now be archived on the website under The Trade. Some trades will be behind the paywall ($10/month) while others will be free.
☘️ Also, I’m still beta testing a trade alert service for FREE. You will receive real time trade ideas via text. These are trades based on technical analysis with a high probability of success.
To participate, text TRADE to 844-949-3002 or click HERE to subscribe. It’s free for now.
Now let’s get to work…
Let’s check in on oil🛢as I see an imminent opportunity presenting itself. This is both for a swing trade as well as the longer term portfolio.
☘️ I wrote two months on February 28th about my upward bias in oil prices.👇
Since that report, oil did EXACTLY what the charts were telling me oil would do. Oil traded from $75 to $83 where it hit resistance at the 200 day moving average.👇
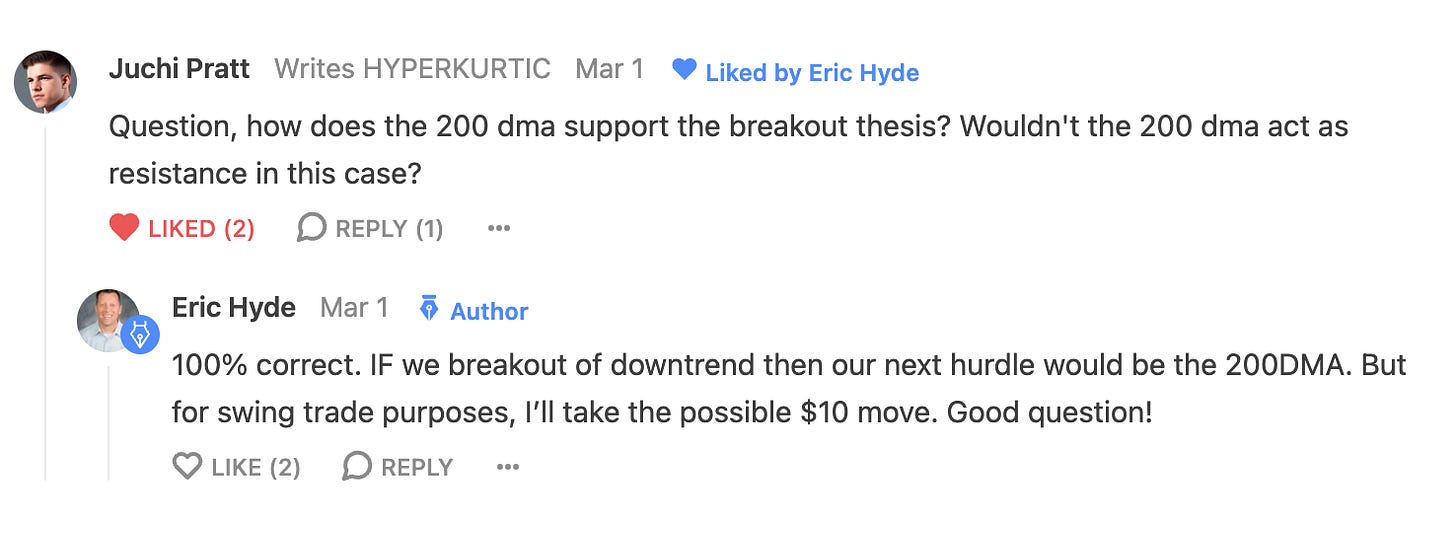
In fact, one of my subscribers
had asked me about the 200 day moving average acting as resistance. He was spot on. And just like I responded to him, the breakout from the down trend would lead us right into resistance at the 200 DMA. And that is precisely where I sold for profit.This next line is extremely important:
From any breakout, I expect a RE-TEST of that breakout. And I believe that is where we are headed now…
But before we look at the re-test on the chart, let’s first reconfirm the longer term trend. I always do this before looking a bit more granular or micro.
Oil - Weekly Chart
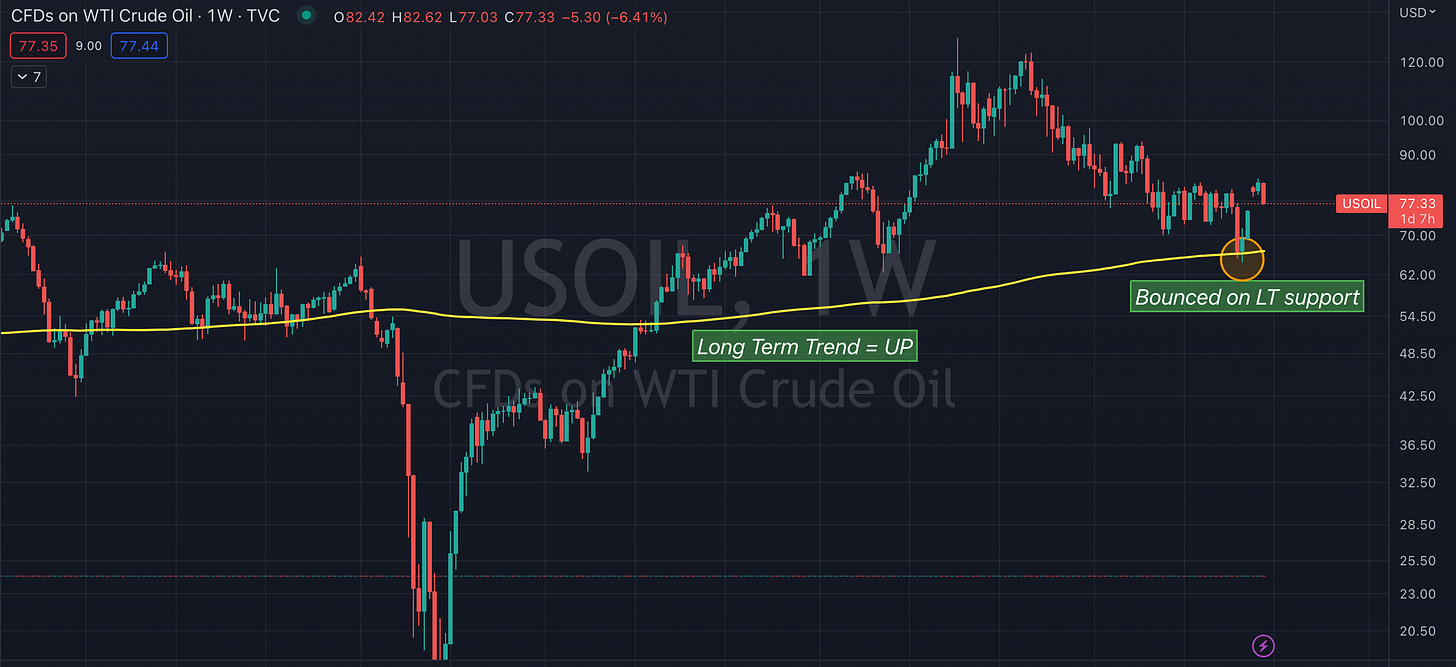
Looking at a longer term view of WTI Crude Oil, I see the following:
Trend is up, yellow line (200 week MA) - we had the spike LOW from covid, then the rubber band effect high with the Ukraine invasion. We’ve now seen a reversion to the mean.
Price tested the key moving average (yellow line) and bounced (orange circle)
Given this chart AND my fundamental analysis, my longer term bias is higher oil prices. 🛢🛢
Okay, so long term trend = bullish oil.
Let’s zoom in a bit more and look at the daily chart.
Oil - Daily Chart
Here is what we already know…
Within the bullish macro trend, the price of a barrel of oil has been in an intermediate term downtrend (white line) since last summer.
Price has tested this downtrend multiple times but failed…
…UNTIL recently - price gapped above down trend on key production cuts.
Now to be fair this wasn’t the breakout of a lifetime but it’s clearly no longer in a downtrend. A break of trend is a break of trend.
Let’s zoom in a bit closer and look at the opportunity presenting itself imminently…
Keep reading with a 7-day free trial
Subscribe to The Tobin Report to keep reading this post and get 7 days of free access to the full post archives.


