


🔷 Trade Alert - Hershey (HSY)
Short and Sweet.

See what I did there? Short. Sweet.
“The Trade” for today is to short Hershey.
Due for a pullback…
The Hershey Company 🍫
🍫 Monthly Chart
50 year channel.
Up against resistance.
Looks like it’s time to sell if you own. Short if you don’t.

🍫 Weekly Chart
Zooming in on the weekly chart.
Sell if you own. Short if you don’t.

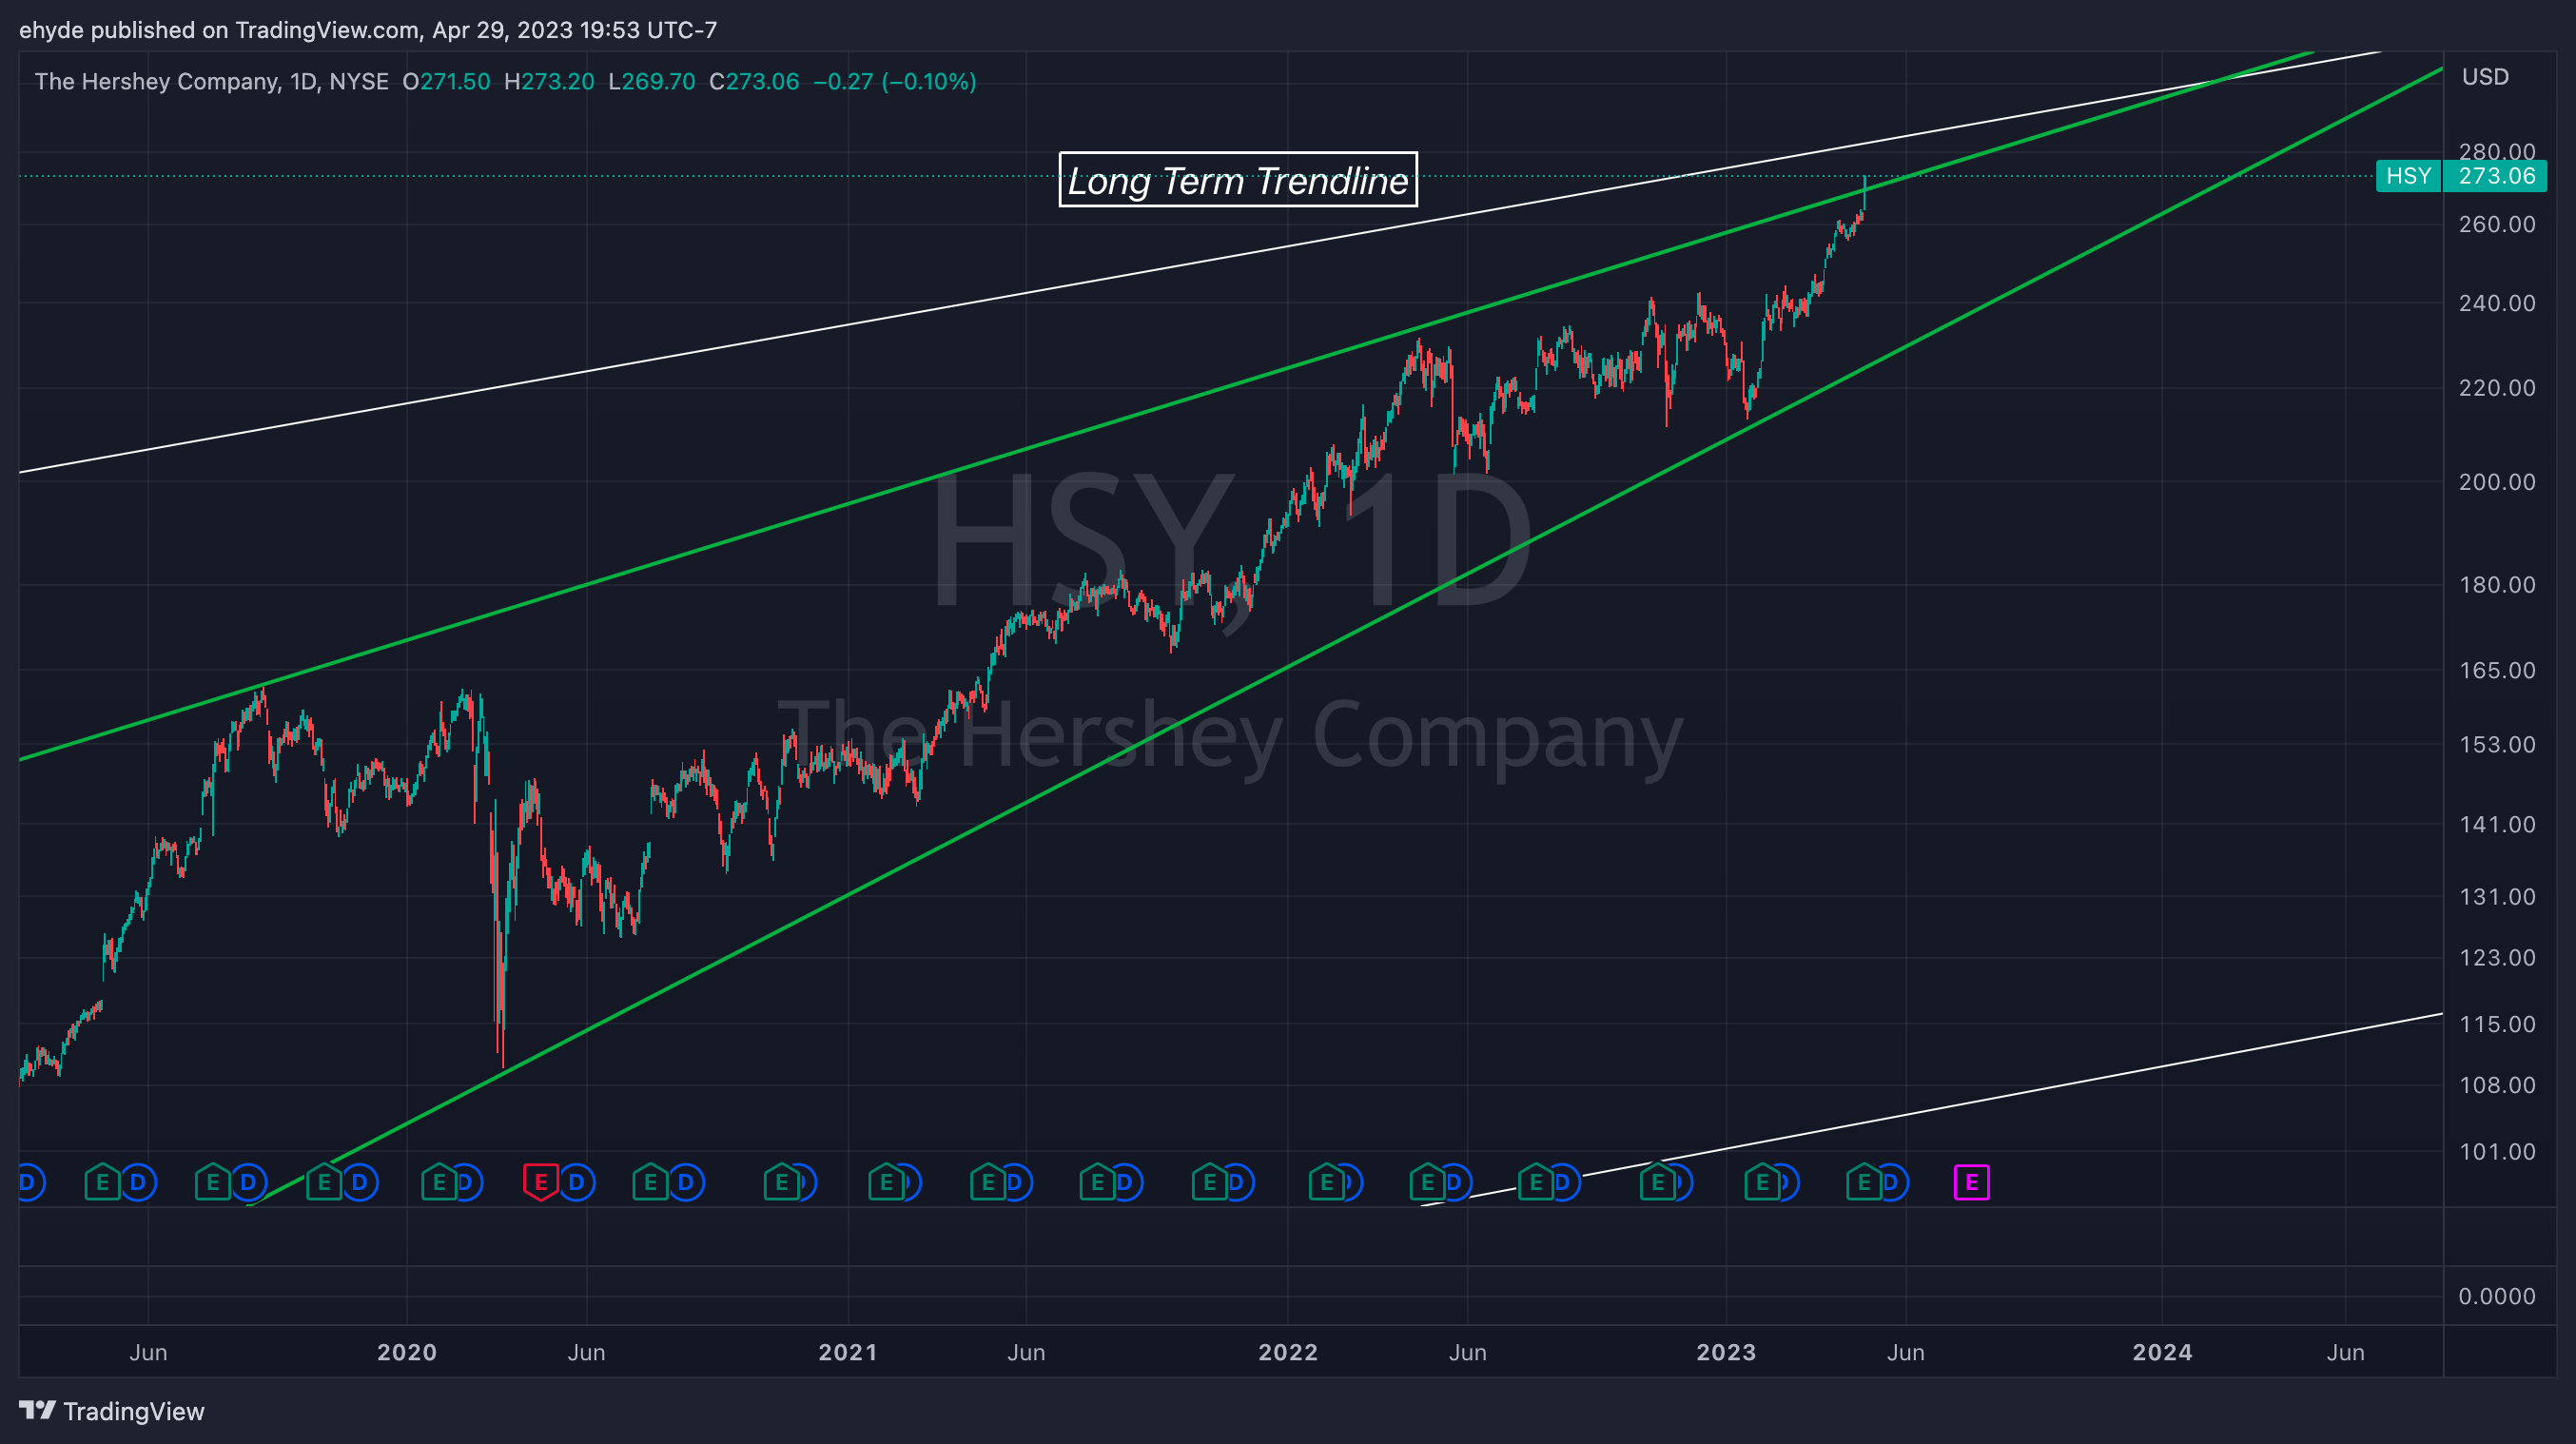
🍫 Daily Chart
Drilling down a bit further. White line is the longer term trendline shown in the previous charts. Green is the shorter term trend.
Resistance.
Sell if you own. Short if you don’t.
🍫 With Moving Averages
50 DMA in blue - 200 DMA in yellow
Price has stretched well above both moving averages, 8.75% and 17% respectively.
Sell if you own. Short if you don’t.

The last time price was stretched this far off it’s moving averages…
…price dropped over 13% in the next few weeks.

For a swing trade…I am a seller here.
Short. Sweet. 🍫
…and maybe a bit cheesy.
Eric