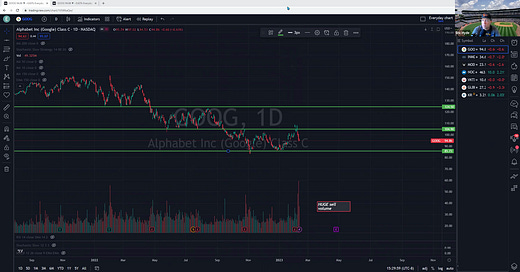
Thank you all for your ticker submissions last week. I thought I’d do something a bit different this week and do a short video on ONE of those tickers, GOOG. I’ll do more videos in the future but here’s one to get started.
I’ll still do a written report of the other submissions, but the video will help give an understanding of how I look at a chart.
If you’re investing in these markets, you MUST be looking at the charts, IMO. Investment banks, hedge funds, large institutions ALL use charts and technical analysis to help them in their decision making process. Why wouldn’t you?
Quick reminder: Technical analysis is not a guarantee that price will move up or down…it’s merely a tool to help identify opportunities in the market based price, time, volume, and patterns. Technical analysis (TA) is used to improve your probability of success and give better entries or exits in a position. It’s a way to identify extremes, human emotions, and whether institutions are buying or selling (based on volumes).
For example, to my eye TODAY, Google is in a downtrend and looks to move lower based on the factors I discuss in the video. I do not own Google, however, but if I were in the position, I would have been a seller into the recent rally. Charting would have guided this decision.
That said, if price retests the upper rail of the channel (you’ll see in the video) and breaks above, my bias might change. Also, if conditions in the overall market change, my bias would also change. (i.e. Fed lowers rates)
For now…GOOG is a sell in my eye. This is not advice, just my opinion. I fully admit I can be wrong on this.
My point is, in technical analysis, you need to be willing to adapt based on new information that comes your way. Never be narrowly focused and unwillingly to change your view.
One factor I did not discuss is…time horizons. If I look at a monthly or quarterly chart (as opposed to the daily price action), Google might look differently. After all, price has moved from its high of $152 per share to its current level of $95. One may think this is ‘on sale’ in the long term. If you think it will be trading at $250 per share in 10 years, then today’s price might be your entry. Could it drop to $80 before it heads higher? Possibly. You’d still be profitable in 10 years, if that’s your time horizon.
Today’s analysis is based on daily price charts with a short/intermediate time frame.
I used Google in today’s video for educational purposes and because it was requested by one of my readers. Adding technical analysis to my toolbox a few years ago was the single best decision I’ve made in investing. Now I’m just trying to share a bit with you all.
More to come this week…
Hope you enjoy. Trade well!
Eric


Share this post