Welcome BACK to The Tobin Report. All things money, markets, and charts.
Yes, that’s right, “Welcome back!”
I took some time away from publishing these reports to take care of a few necessary ‘life’ items. And in that time, I realized how much I missed sending these out to everyone.
So I’m back. Boom. 💥
For those of you new here, a brief description of The Tobin Report:
My name is Eric, author of The Tobin Report. I’m just a dude on the internet with a passion for markets and investing with a specialty in technical analysis, precious metals, uranium….and old fashions. 🥃
🎯 My goal is to educate, entertain, and give trade setups.
💻 I do not day trade so all trade setups are for either long term investments or swing trades meant to be held for weeks or months.
Okay, let’s get to work…
🪙GOLD
Let’s talk about gold. You all know I like gold. And silver. And old fashions. 🥃
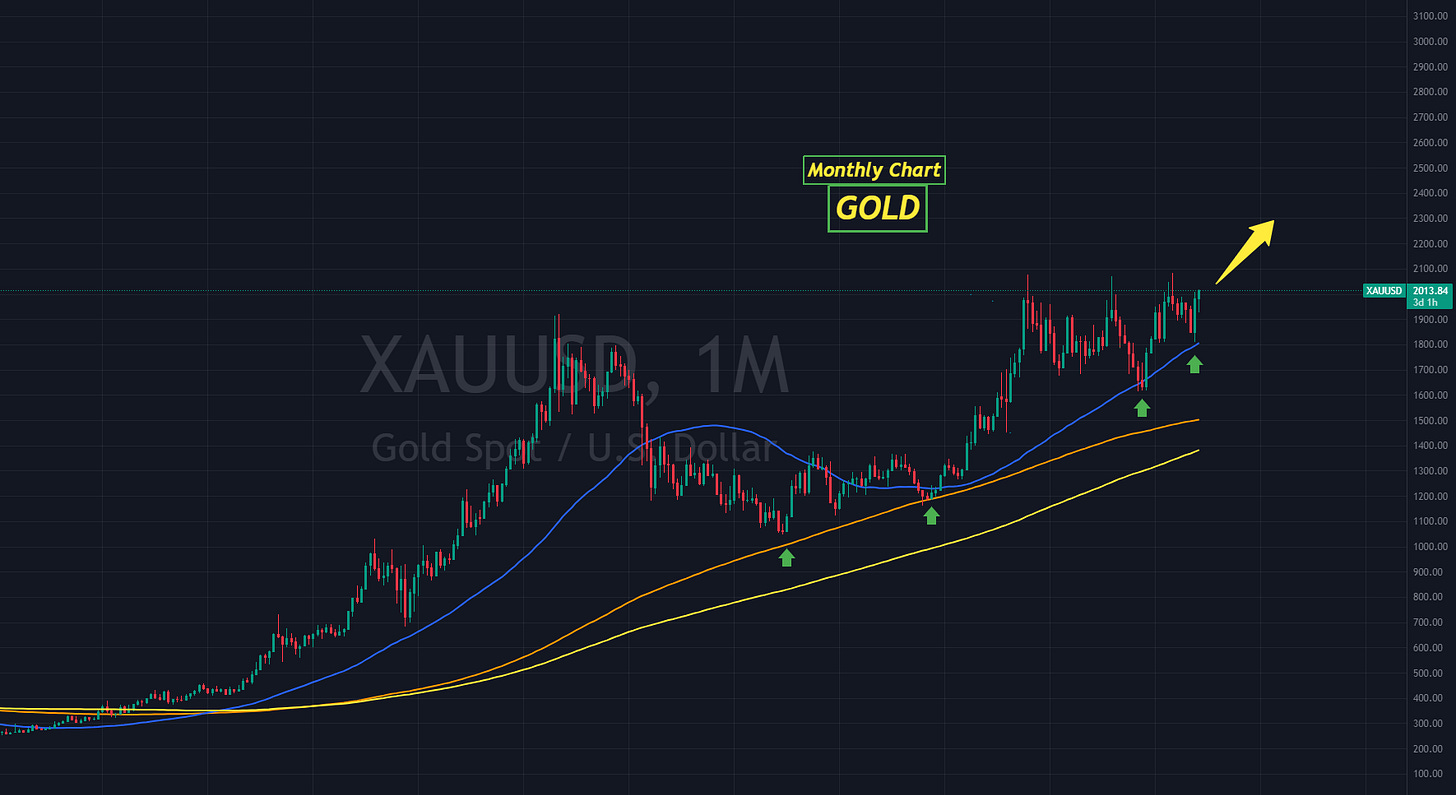
Below is the monthly chart of the safe haven metal going back several decades. THIS. IS. BULLISH. Everything about this chart says gold is going higher…and soon! 📈
Technically speaking, it is on the verge of a break out. Moving averages are also lined up:
Monthly Moving Averages:
50 MA (blue line) on top of the 150 MA (gold line) on top of the 200 MA (yellow line)…and pointing up. ↗️
Each up thrust in price on the chart coincides with the US government printing money out of thin air.
➡️Dot Com bubble. ➡️Great Financial Crisis. ➡️Covid.
What event will cause the US government to print more money?
🔴Maybe a bond crisis? 🔴Banking failures?
It will happen.
Tomorrow? No idea. Next month? Not sure. Could price correct a little? Of course? Am I answering my own questions? Looks like it.
Yes, I’m back baby.
What happens when hedge funds and portfolio managers decide it’s time to invest in gold? The chart below shows they haven’t even started! …and yet gold is ready to break out.
This further reinforces the strong case for gold because this shows the consistent neglect as a defensive alternative over the past few decades.
If traditional investment strategies and central banks begin to shift towards the metal, it could likely represent one of the most compelling investment opportunities in gold EVER.
Is NOW the time for gold?
Q: When does gold outperform?
A: After the Fed stops hiking interest rates. Every time.
The Fed’s last hike was in July.
They did not raise rates the last two meetings.
Will they raise in December?
95% probability of no hike.
Looks to me like they have stopped hiking rates.
🪙 JUNIOR GOLD MINERS
So how do I plan on capitalizing in the next leg up as gold breaks out above $2100 an ounce?
Junior miners.
I have a carefully selected list of individual companies that are drilling, getting permits, and building mines to pull more gold out of the ground.
If I did not have the time or interest in doing due diligence on specific companies, I might look at a basket of junior mining companies like the GDXJ, for example, which is the Vaneck Junior Gold Miners ETF.
Since The Tobin Report is all things charts, let’s look at 3 charts of GDXJ and I’ll illustrate why this trade looks good to me.
1️⃣ Weekly Chart - CHANNEL (click the chart to enlarge)
Price has been in a channel since 2016
Currently at the lower rail of this long channel
Given the macro environment, price is poised to AT LEAST re-test the upper rail
2️⃣Weekly Chart - WEDGE
Time frames zoomed in - 2020 to now
Price coiling within wedge pattern
Price has oscillated between rails of wedge
Bias is for a breakout to the upside in the coming weeks/months
Let’s zoom in a bit more…
3️⃣Daily Chart
Green downtrend line since April 2023
Recently broke above - bullish
Bearish to bullish reversal
Technical conclusion:
I’m a buyer of GDXJ on pullbacks for this next leg up in gold.
Fundamentals and technicals all point to higher gold prices for 2024.
Oh yeah, I forgot to mention…as gold breaks out to new all time highs…what ALWAYS follows?
🥈 SILVER.
That’s all for now. I’ll be sending out more charts soon!
Eric


