


When Is The Best Time To Invest?
Plus I'll give you TWO companies at critical lows...a 'buy' in my book.

Welcome back to The Tobin Report. All things money, markets, and charts.
For my new subscribers, welcome…and thank you for reading.

…or pretending to read, lol.
The Tobin Report is now reaching readers in 38 US states and 41 countries!

I’m pretty stoked at the amount of readers across the US that pretend to like The Tobin Report. Maybe my mom sent an email to a bunch of people asking to support her son. Boom. Either way, I appreciate it.
Yes, I just said boom.
Anywhoo, if you’re here and not yet subscribed, feel free to do so here: 👇🏽
Okay, let’s get to work…

Let’s discuss when it’s time to be an opportunist and buy! (not sure why I used an exclamation point here) (I guess I could have edited it to a . instead…but this was more fun, lol)
Making money in any market is really about when you buy. If it’s ‘easy’ to buy, it may not be the best time. What do I mean?
Well, when a stock is running high and doing well, many people buy, buy, buy because it’s doing well. It’s easy because “it’ll just keep going up.”
But when that happens, the real risk is that people start taking profits and price corrects. If you were buying all the way up, you might get caught with the bag.
But the real opportunity is in buying something undervalued.
“Buy low, sell high.”
Yeah, yeah, we’ve all heard it, yes. And it’s much easier said than done. What that means is investing in something that is not popular…investing in that thing when nobody else is…and when sentiment is poor.
And the truth is, if you want to make real money, THAT is the time to buy.
Not always easy to do. I get it.
Unfortunately, for many people, it’s difficult to invest in a company when it is beaten up and out of favor. Seeing red on the screen causes many to want to sell…usually out of panic or fear. They give up and throw in the towel.
👉🏽 But that is precisely the time to buy.
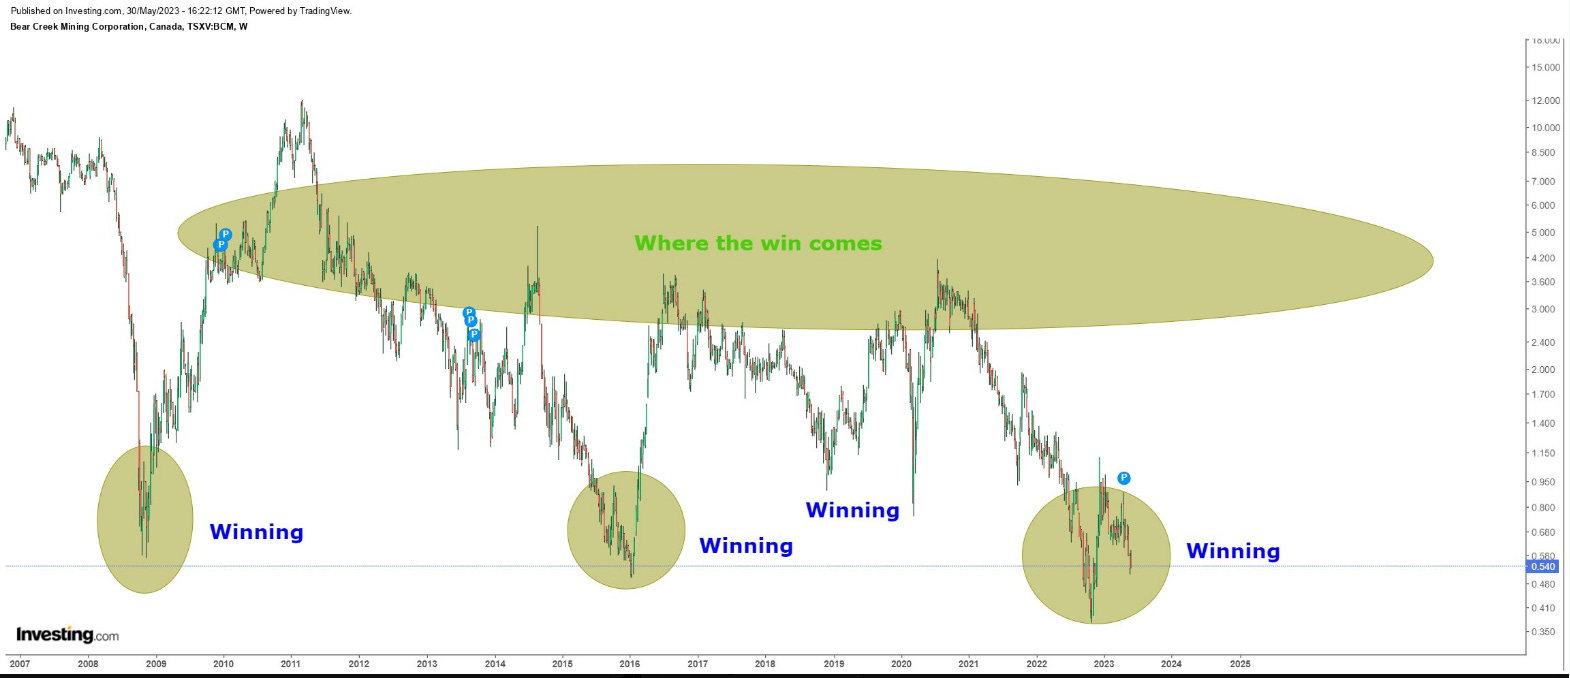
Let’s look at the chart below. It’s less important to know what it’s a chart of than what it represents.
The first two shaded ovals marked THE low before heading higher. I wonder how many would have sold near the low because they were emotional and scared?
Though this chart is an example, it is also precisely where we are NOW in the resource market. This is a chart of Bear Creek Mining (BCEKF) going back a decade.
Could now be the time to buy?
For those of you investing in resources for your portfolio (oil, gold, silver, uranium, lithium, etc), you’re probably thinking of throwing in the towel.
You could.
Or you can use charts like this one (now above you, lol) to make more informed decisions about where we are in the cycle. Each intermediate top was preceded by a deep low. Those deep lows were your opportunity.
So when you’re in a deep low, understand you might be on the cusp of breaking out.
It’s obvious when you see it on a chart, but this should help take the emotion out of it.
Step outside of your emotions and think objectively. Buying low requires stepping in when it’s tough to do so.
Now I’m not saying to step in blindly and buy something just because it’s beaten up. Make sure you understand your thesis and why are you investing in the thing you’re investing in.
For Me…
Do I think natural resources are the place to invest for the next decade? I do. Do I think resource stocks (as a whole) are closer to a bottom than a top? Yup.
There are limited resources on Earth. Demand increasing. Global trade is contracting.
Prices will go higher.
In 2 years I will be grateful I did not sell at the low.
Just my 2 cents. Take it or leave it.

Two Companies Set to Move Higher
Let’s look at a two companies at significant lows ready to make a move higher. The fundamentals are in place. The technicals are in place…
Keep reading with a 7-day free trial
Subscribe to The Tobin Report to keep reading this post and get 7 days of free access to the full post archives.