

Everything Is In The Chart
Technical analysis and why it works.


As we move from the recent rate hiking cycle to the upcoming rate cutting cycle, there will be MANY investing opportunities if you look in the right place. There will be a shift in money flows. For example, from technology to commodities. Or from big tech to small cap. Start thinking about what sectors, industries, companies will do well in a lower rate environment. REITS (Real Estate Investment Trusts), for example, are doing well, for obvious reasons. Companies that did poorly in the rate hiking cycle might do well in the upcoming rate cutting cycle.
The chart below is the daily chart of XLRE, the Real Estate ETF. The orange line is the 150 day moving average. Price broke through some resistance (green horizontal line) and has been moving higher. *This is not a recommendation to buy now as it’s a bit stretched from its moving average. But you can see price has reversed from a downtrend to an uptrend.
Maybe wait for a retrace to add or initiate.

There are many ways to find these opportunities, but as you can see, I rely on charts to tell me where money is rotating into. Why? Because I can SEE it. I don’t care about earnings and I don’t rely on mainstream media. It’s all in the chart.
EVERYTHING is in the chart.
Chart analysis is not magic but it is a collection of human psychology, a visual display of supply and demand, and a history of patterns that tell a story. It is this collection that help investors predict future price movements. And it works.
By identifying trends and using objective criteria, you can make more informed decisions. It is not always 100% accurate and has its flaws, but technical analysis gives me insights that has significantly improved my trading strategies.
Before I get into some charts, I’ll explain a bit more…
Market Psychology
Technical analysis works because it shows the psychology of investors and speculators. Stock prices are driven by the collective actions, emotions, and behaviors of investors. Chart patterns and trends reflect these collective behaviors and can signal where market sentiment is likely to lead.
The behavior of investors creates patterns on the chart. These patterns are recognizable and repeatable. Chart patterns are the stories of buyers and sellers, where they were…and likely where they are headed.
Supply and Demand
Technical analysis relies on the basic concept of supply and demand. Prices move based on the balance between buying and selling pressure. Chart analysis helps identify key support and resistance levels where buying and selling pressures converge.
Chart of SWK below. Clear levels of resistance and clear levels of support. If price breaks above resistance, we have a new floor….and significant upside potential. You can also see this was a bearish to…….almost bullish reversal. Waiting and watching. If price breaks above……I’m a buyer! If price gets rejected at that resistance level, I’m a seller….or NOT a buyer, thus saving me money and frustration.

Support levels indicate where demand is strong enough to prevent further declines, while resistance levels show where selling pressure is sufficient to halt upward movements. By identifying these levels, I am better able to decide whether to enter or exit a trade with a high degree of probability.
Trend Identification
One of the core principles of technical analysis is to first identify the trend. Trends—whether up, down, or sideways—tend to persist over time due to market sentiment. Obviously trends change…and recognizing these changes will dramatically improve your P/L. My favorite is recognizing a longer term bearish to bullish reversal.
I use trend lines and moving averages to identify continued moves in price and also for potential reversal points. This helps in making informed decisions about entering or exiting trades based on the prevailing trend.
Look at the chart below of Disney (DIS). The trend is clearly down. But what has started to shape up in the last couple days is a reverse in trend. Price is breaking out of the downtrend line. Yes, I drew that downtrend line but price is what is guiding that. A Low of $83.91 was put in on August 8th (yellow arrow). Then a higher low of $86.59 on September 11th (2nd yellow arrow). Price has started to stair step higher. If price breaks above $91.80 (red arrow), we will have officially broken the downtrend with a higher high.
Looks to me like DIS is headed higher.

Volume
Another indicator I use to determine if a price move is real or not is volume. Whether a price moves up or down, large volume is a key signal in confirming the strength of a breakout or trend.
A price move accompanied by high volume is often seen as more reliable than one with low volume.
Objective Decision Making
When done properly, technical analysis provides a systematic and objective approach to decision-making. No emotion. By relying on historical data and specific metrics, you can base a decision on clear criteria rather than subjective judgments or guesses. I use chart patterns, indicators and trend lines to keep my decisions objective and consistent.
And lastly, I continue to study and use technical analysis because it works!
Now let’s get into a couple previous Tobin Report examples:
NVDA
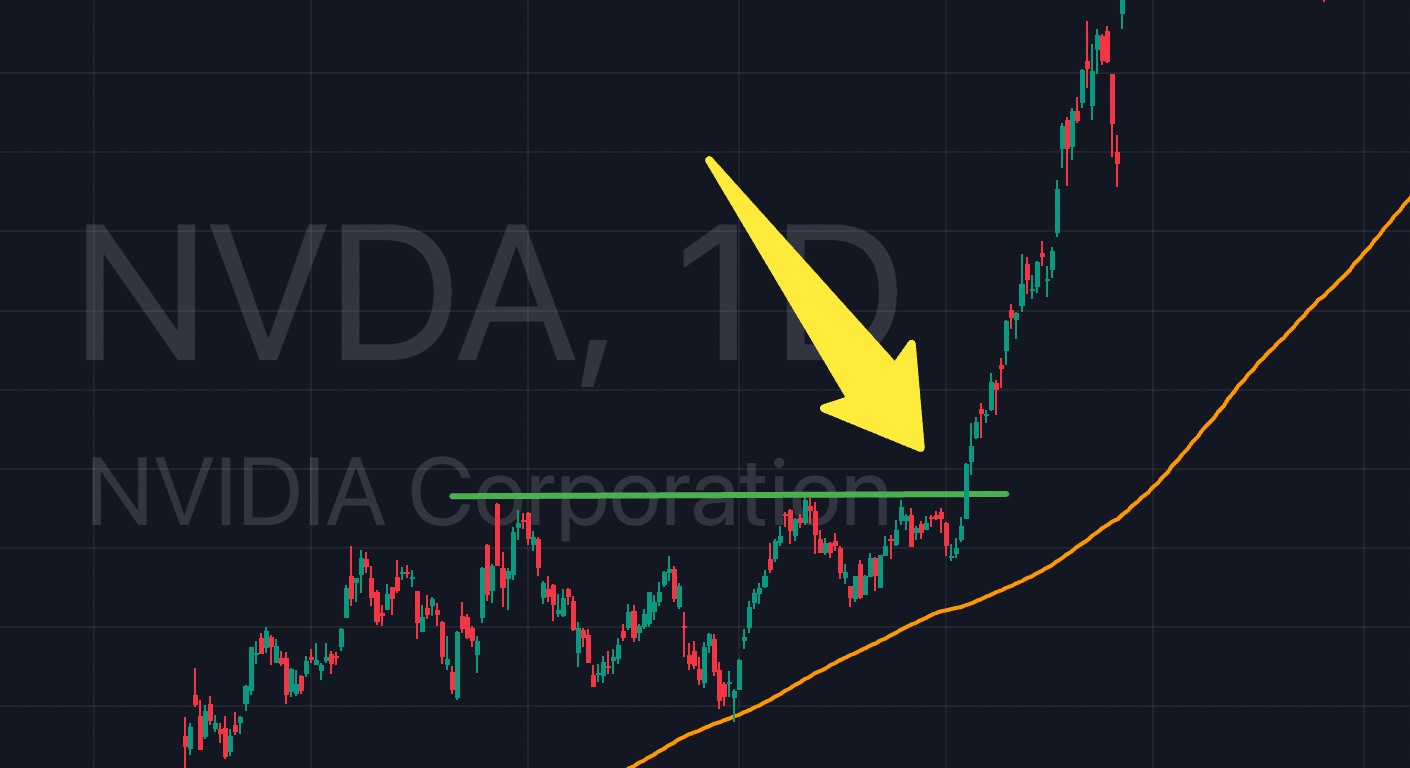
If you recall, I wrote on Dec. 19th, 2023 about the imminent breakout in NVDA. You can re-read it here. The chart was bullish and telling us there was a probability of a breakout. Test of key moving average. Price bumping against resistance multiple times. Trend up. It was telling you what was likely to happen next!
Two weeks later, NVDA began its epic run to almost triple its value in six months. The breakout was on high volume telling us this was real.

Another Example:
STLA
I wrote about STLA on January 18th, 2023. Read it here. Double bottom. Bearish to bullish reversal. Moving average support. Price retesting former resistance. Everything in the chart telling us price was moving higher.

And it did. 50% higher in just a couple months.
These chart patterns are everywhere in markets. Not all of them will work so risk management is important.
Next report, I’ll dive into some charts I’m looking at.
Thanks for reading.
Eric