


Is STLA a BUY?
We shall see. Let's look at SIX charts of STLA. Plus we follow up on two other trades I put out last month, TSLA and NVDA.


A friend of mine asked me to look at STLA…so I thought I’d share this one with everyone here since it looks so beautiful.
STLA - Stellantis
Stellantis NV engages in the design, manufacture, distribution, and sale of vehicles. It offers its products under the Abarth, Alfa Romeo, Chrysler, Citroën, Dodge, DS, Fiat, Fiat Professional, Jeep, Lancia, Opel, Peugeot, Ram, and Vauxhall brands.
But as you know, I’m all about techicals…
👉🏽 So here we go…
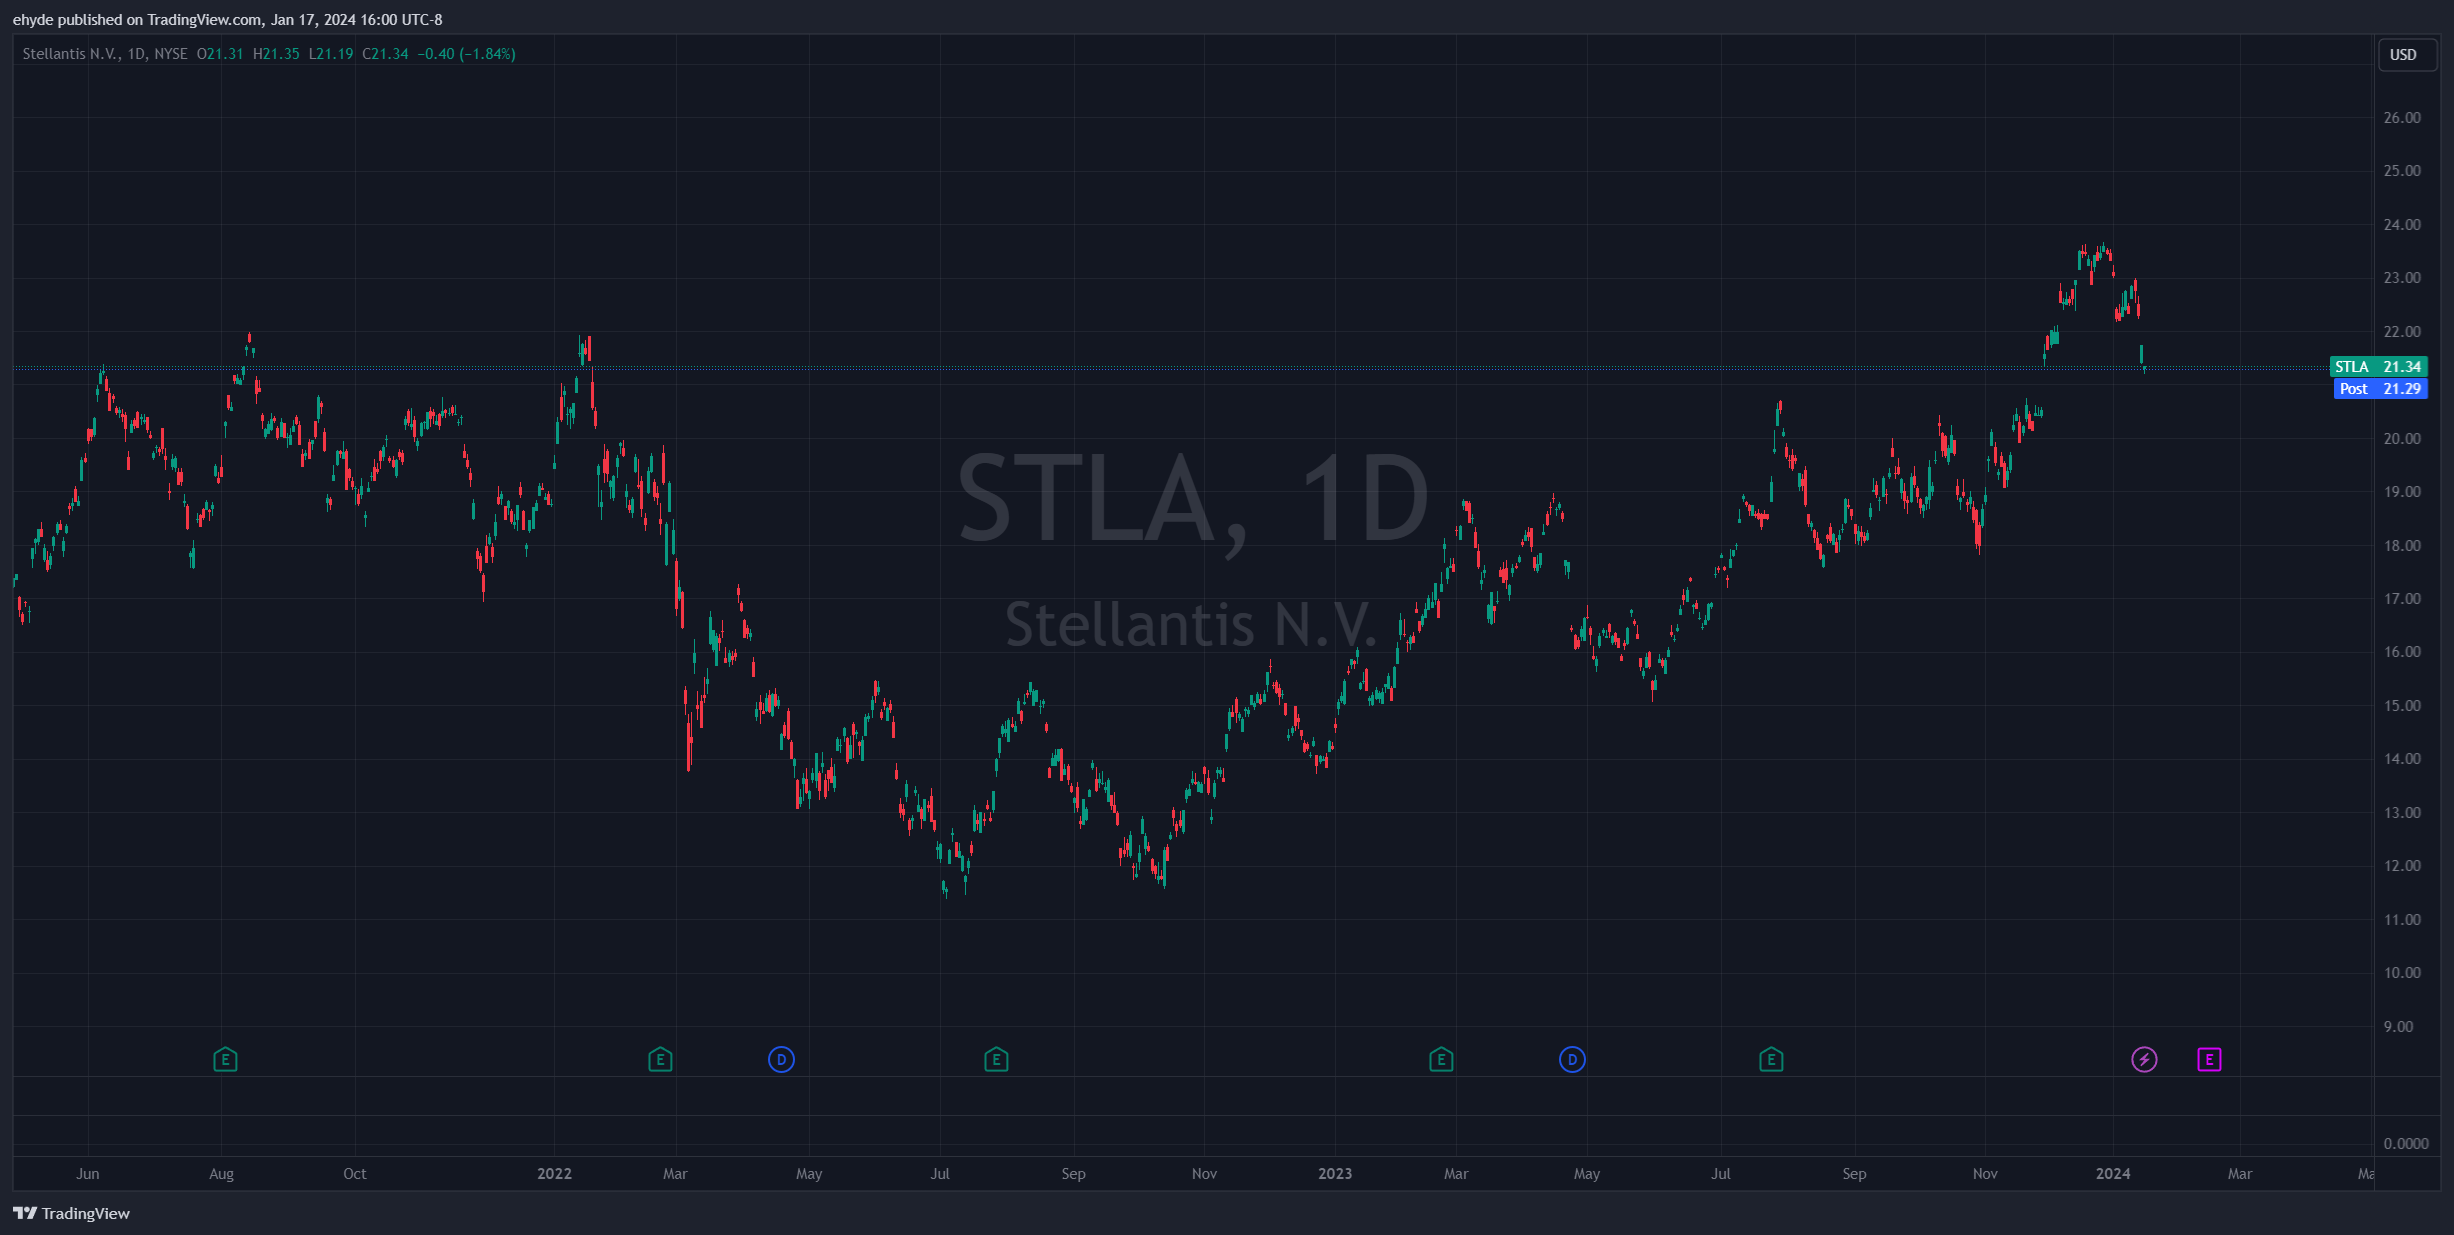
1️⃣ Daily Chart - looking back a couple years
No lines, no graphs, no bias or opinion - price only
Price bottomed in October 2022 and has been marching forward in an orderly fashion
2️⃣ Same Daily Chart
Downtrend to double bottom to reversal of trend - UP
Stairstep fashion, orderly
Classic BEARISH to BULLISH

3️⃣ Daily Chart with 200 Day Moving Average
In an uptrend, price making higher lows EXACTLY along the 200 DMA
When price stretches too far above MA, price comes back and tests it
Will it happen again? Patience needed

4️⃣ Same Daily Chart
Well defined zones in a perfect parallel channel
Price bounces off upper and lower rail PERFECTLY
Price currently in the middle of the zone…
Again, patience needed

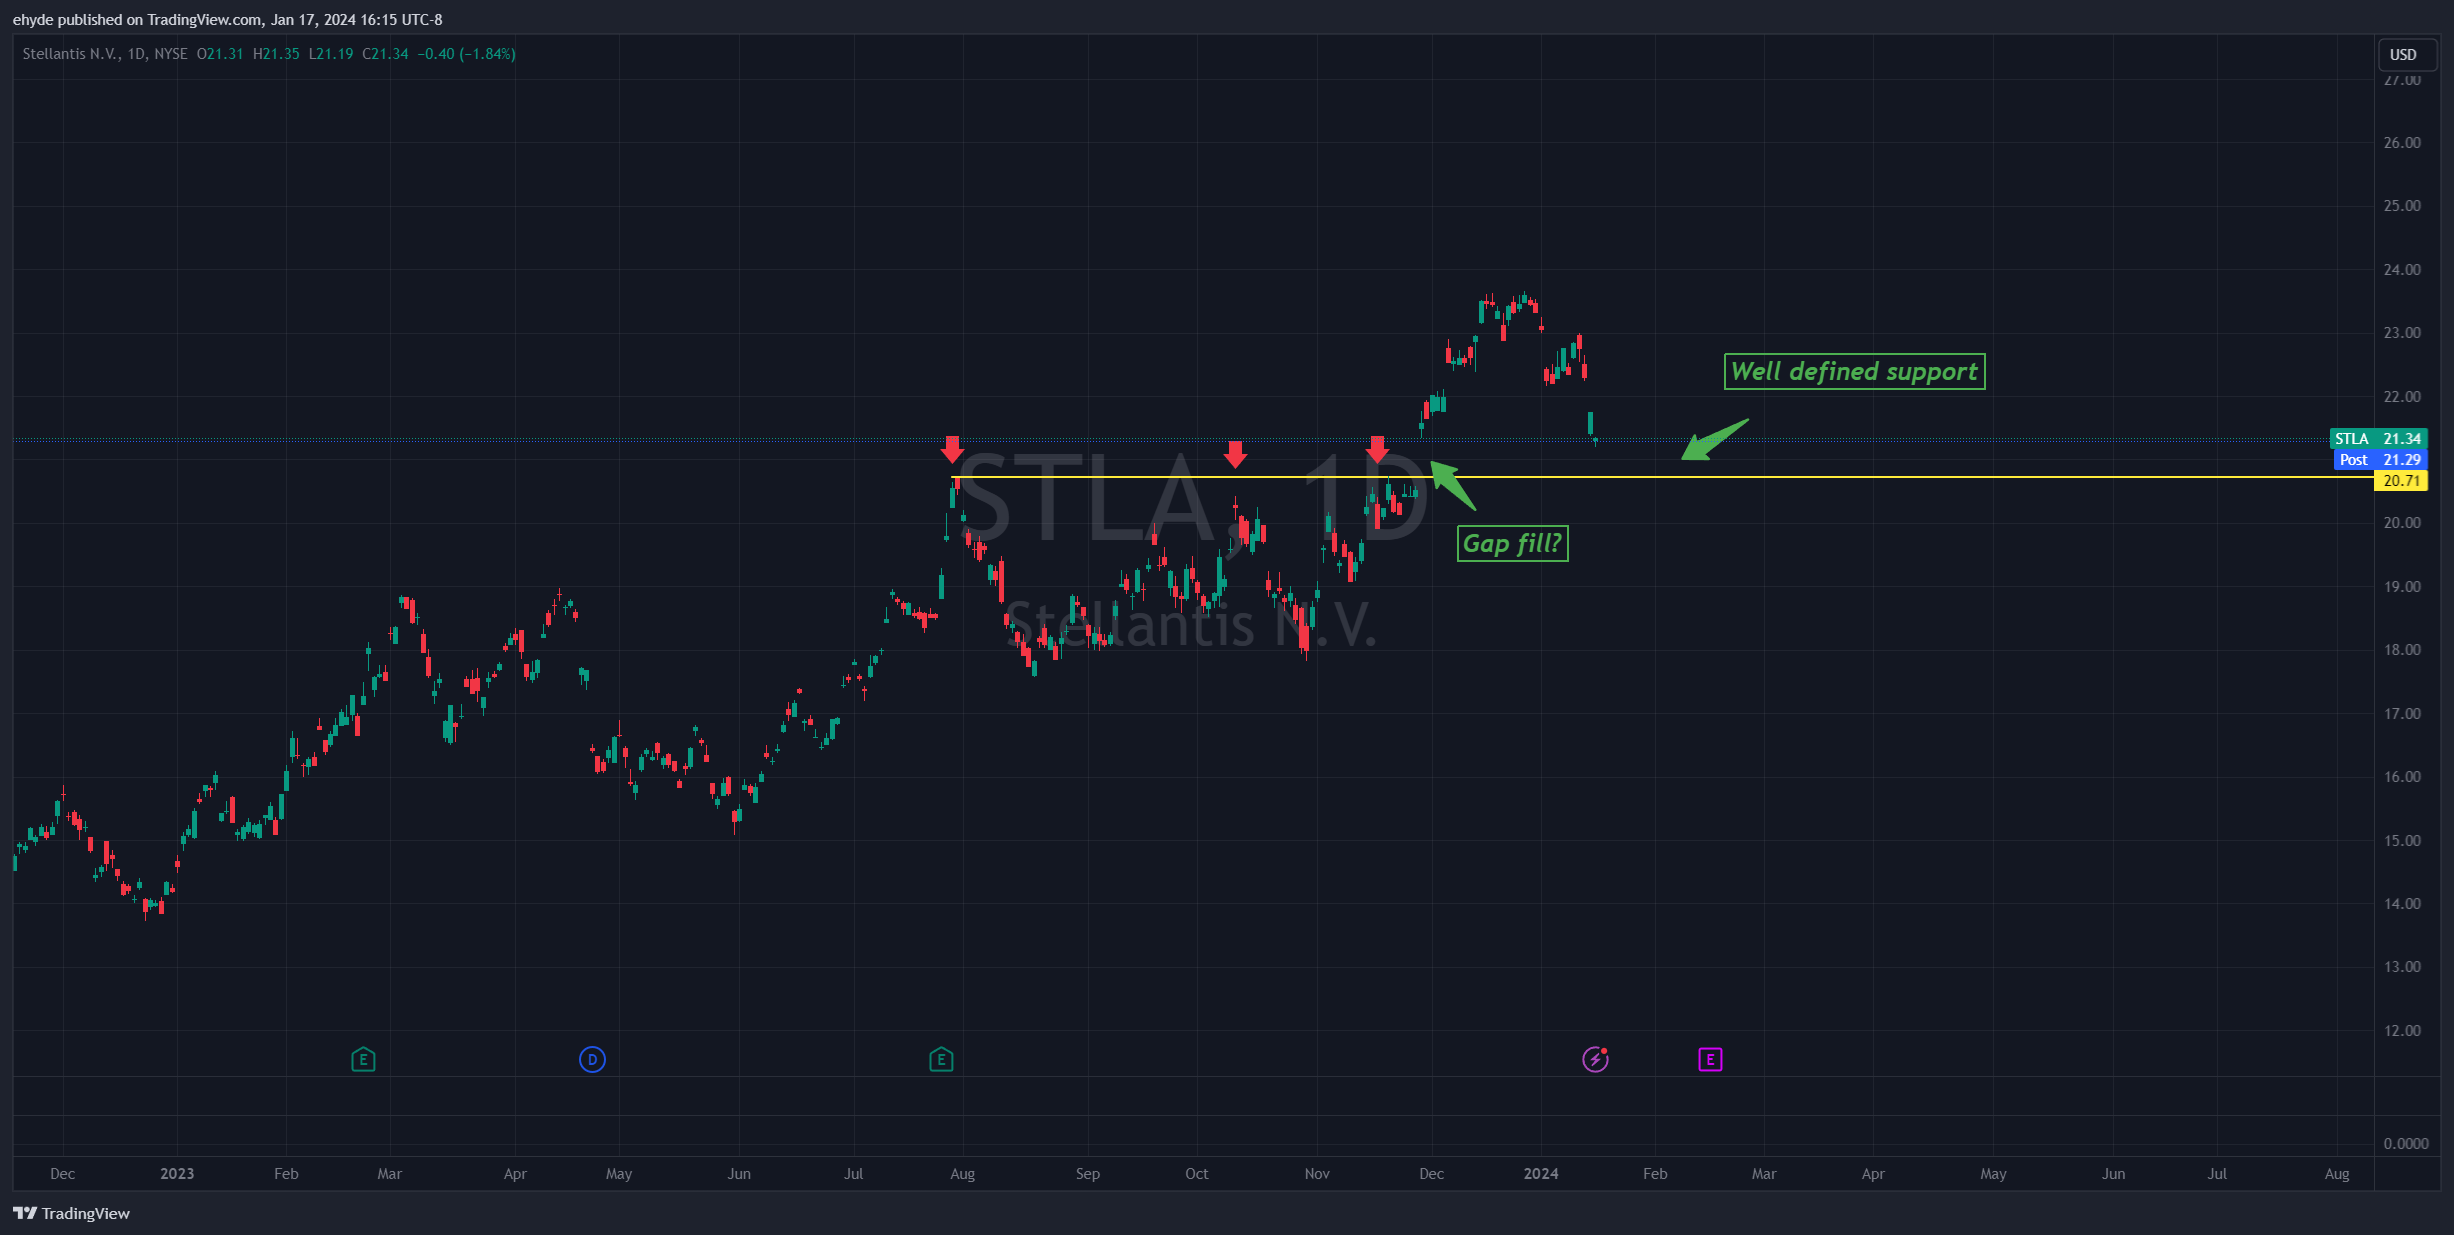
5️⃣ Same Daily Chart - zoomed in a bit
Price kept hitting resistance (red arrows) before breaking through
Will the gap get filled around $20.60? My eye tells me yes.
Will prior resistance become new support? We shall see!
6️⃣ Same Chart Yet Again
Well defined uptrend - price hitting uptrend to the penny
Are we entering a buy zone? ….almost…

📜My Take:
I like the chart of STLA but I’m not a buyer at these levels...YET.
Two levels I like:
Gap fill at roughly $20.60
Test of lower rail of support at $19.50
Since I like to enter trades in batches, as opposed to all at once, I’ll put my limit orders at those levels and be patient. If I miss it, I miss it. There will be others.
And there you have it…STLA in six charts.

Follow up trades from last month:
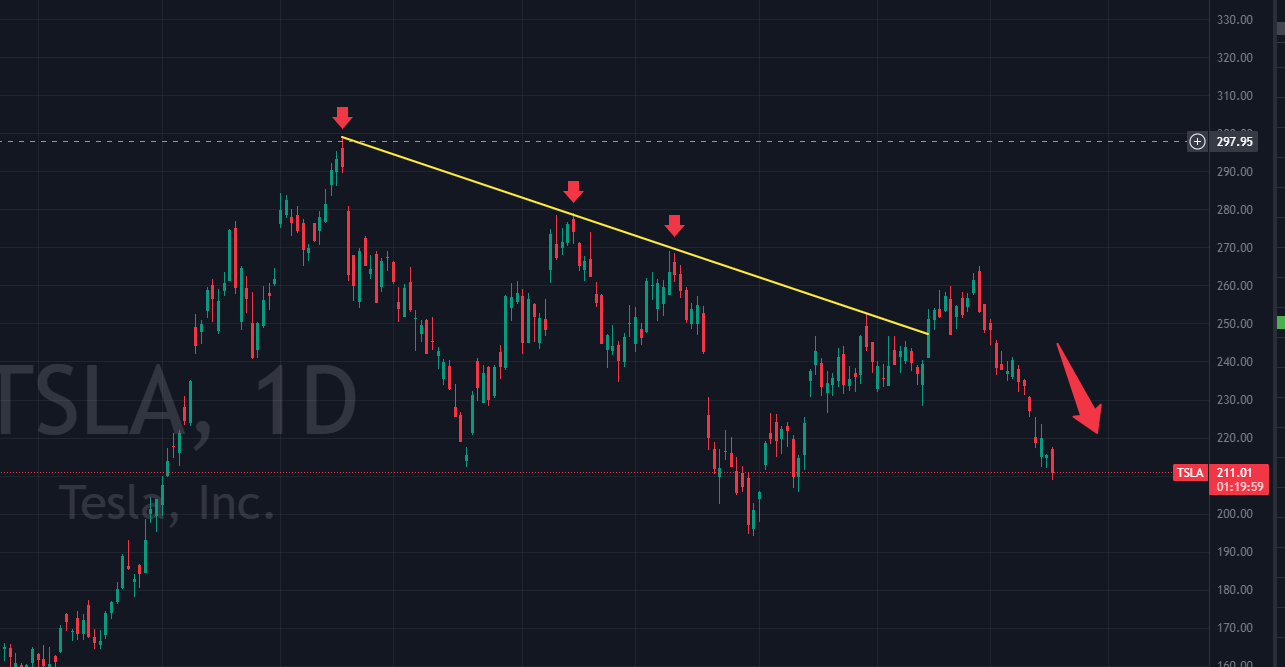
I wrote last month about my bias for both NVDA and TSLA. NVDA was on the verge of a breakout and TSLA was on the verge of a breakdown.
Both have evolved as the charts were telling us. I will be taking profits in both.
Both reports are here:
Below are charts of NVDA at the time of my report followed by current charts. A 15% gain in one month. Not too shabby.


And here are TSLA’s charts, then and now…17% in a month as well. Still a great profit for those who shorted it:

That’s all for now,
Eric