

Have We Seen The Bottom?
A look at the rate hiking cycle will tell us.


Welcome back everyone. Thanks for reading The Tobin Report.
In this report, we’ll look at:
What is the Federal Reserve
Have we seen the bottom in markets?
Different sectors bottom at different times
Market bottoms and Fed Rate Hiking Cycles - are we close?
Bonus insight - Where are large bank clients investing in 2023?
I cannot tell you when markets will bottom, but I can tell you when markets have bottomed historically.
There are MANY metrics to use to determine this, however, I will focus on the Federal Reserve’s rate hiking cycle.
But before I move on, I feel it may be important to briefly discuss what the Federal Reserve actually is.
The Federal Reserve
The Federal Reserve, AKA "the Fed," is the central bank of the United States, created in 1913. It was created by the Congress to provide the nation with a “safer, more flexible, and more stable monetary and financial system.” (laughable, by the way)
There are 5 specific roles of The Federal Reserve but for the purposes of The Tobin Report, I’ll focus on ONE:
To conduct the nation's monetary policy by influencing money and credit conditions in the economy in pursuit of full employment and stable prices.
What the hell does that mean?
The Fed’s monetary policy controls the quantity of money in the system.
Simply put, when the Fed raises interest rates, the supply of money in the system contracts. People generally borrow less in this environment. Asset values typically decline.
Lowering rates expands the money supply. Money becomes cheaper and easier to borrow.
We are currently in the contractionary phase.
Okay, enough history.
How does the rate hiking cycle tell me when the stock market will bottom??
Let’s take a look..
First, it’s important to understand that not all markets bottom at the same time.
If you recall from The Tobin Report Launch (you can read it again here) back in July, I posted a chart that shows the 4 phases of a market cycle.
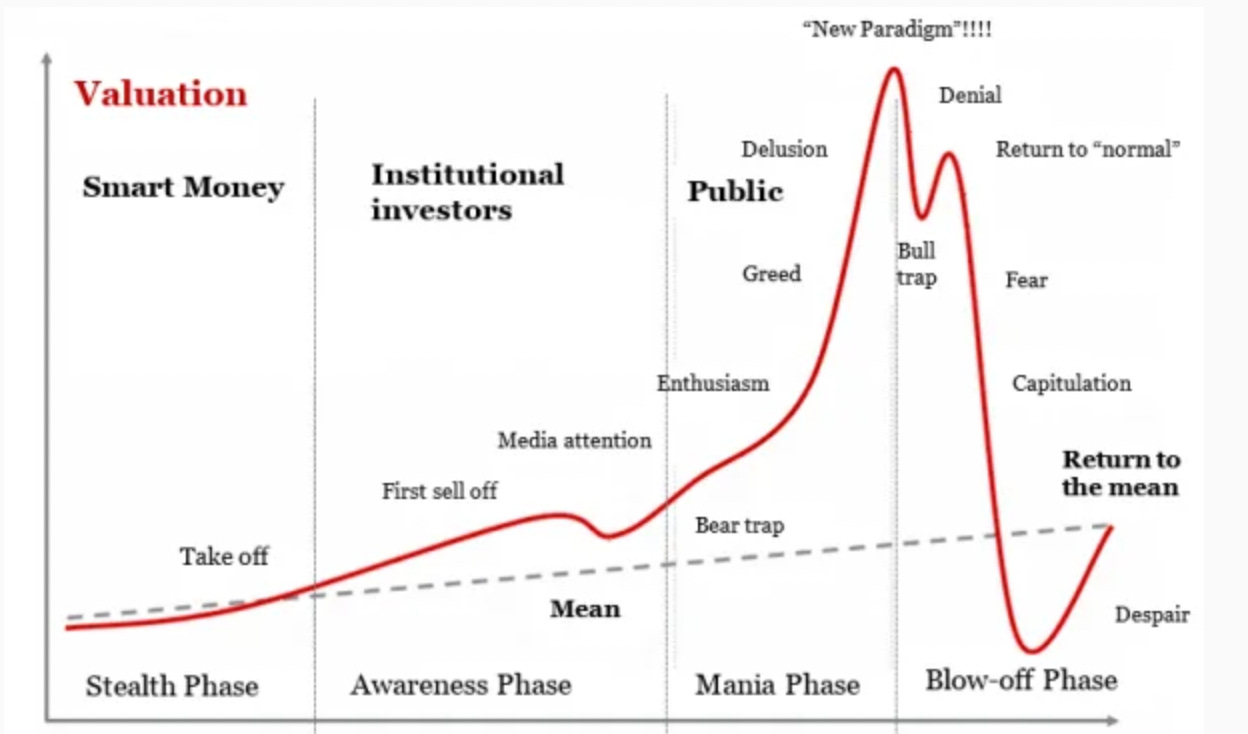
The technology sector, for example, is clearly in the blow-off phase and has been selling off. Higher interest rates = lower asset values (typically). Based on where we are in both the rate cycle (still hiking rates) and the current condition of the economy (weak), I believe the equities market still has lower days ahead and has not bottomed.
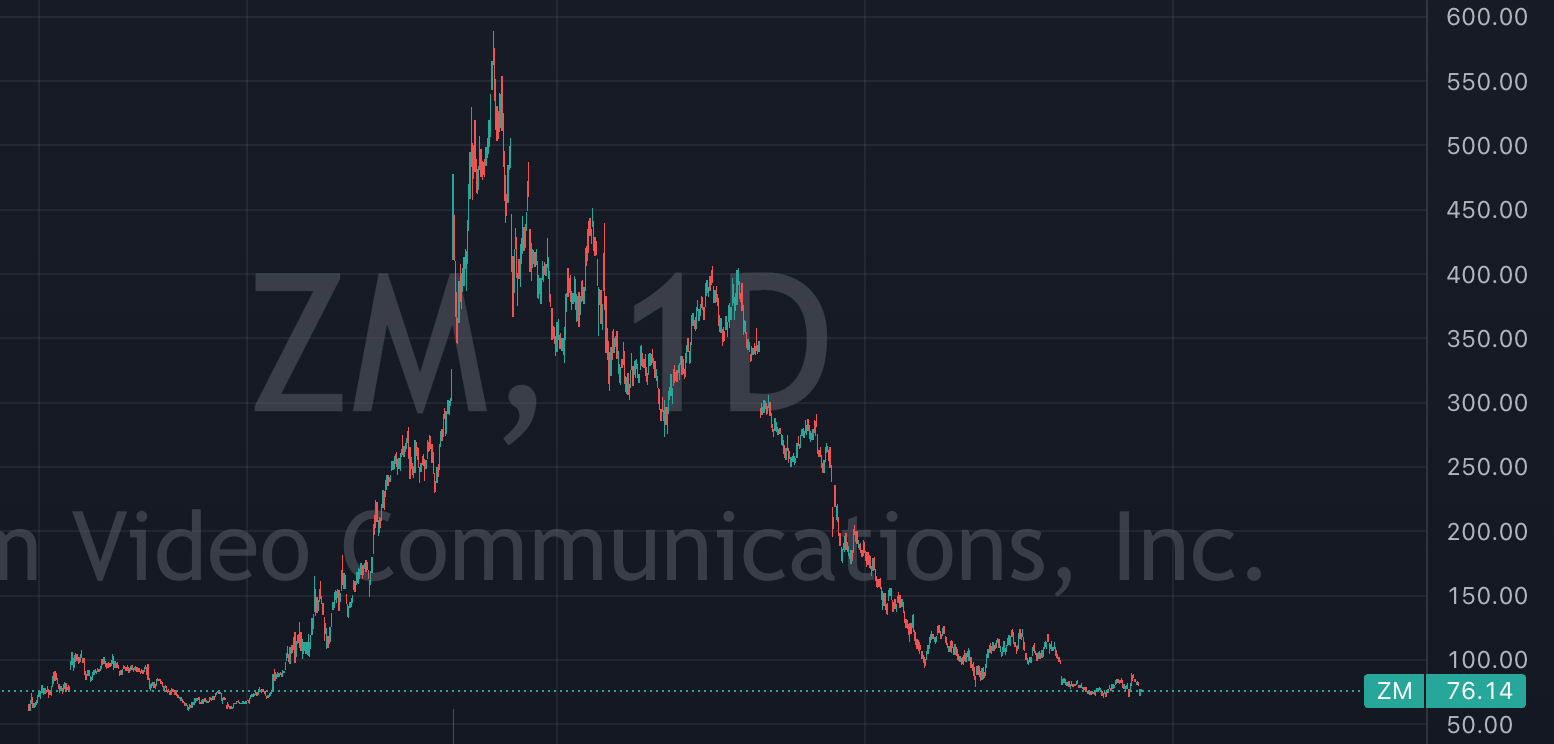
But let’s look at a couple charts: Zoom and Bitcoin. (random picks - as there are MANY others in this phase)
Zoom:
Bitcoin:
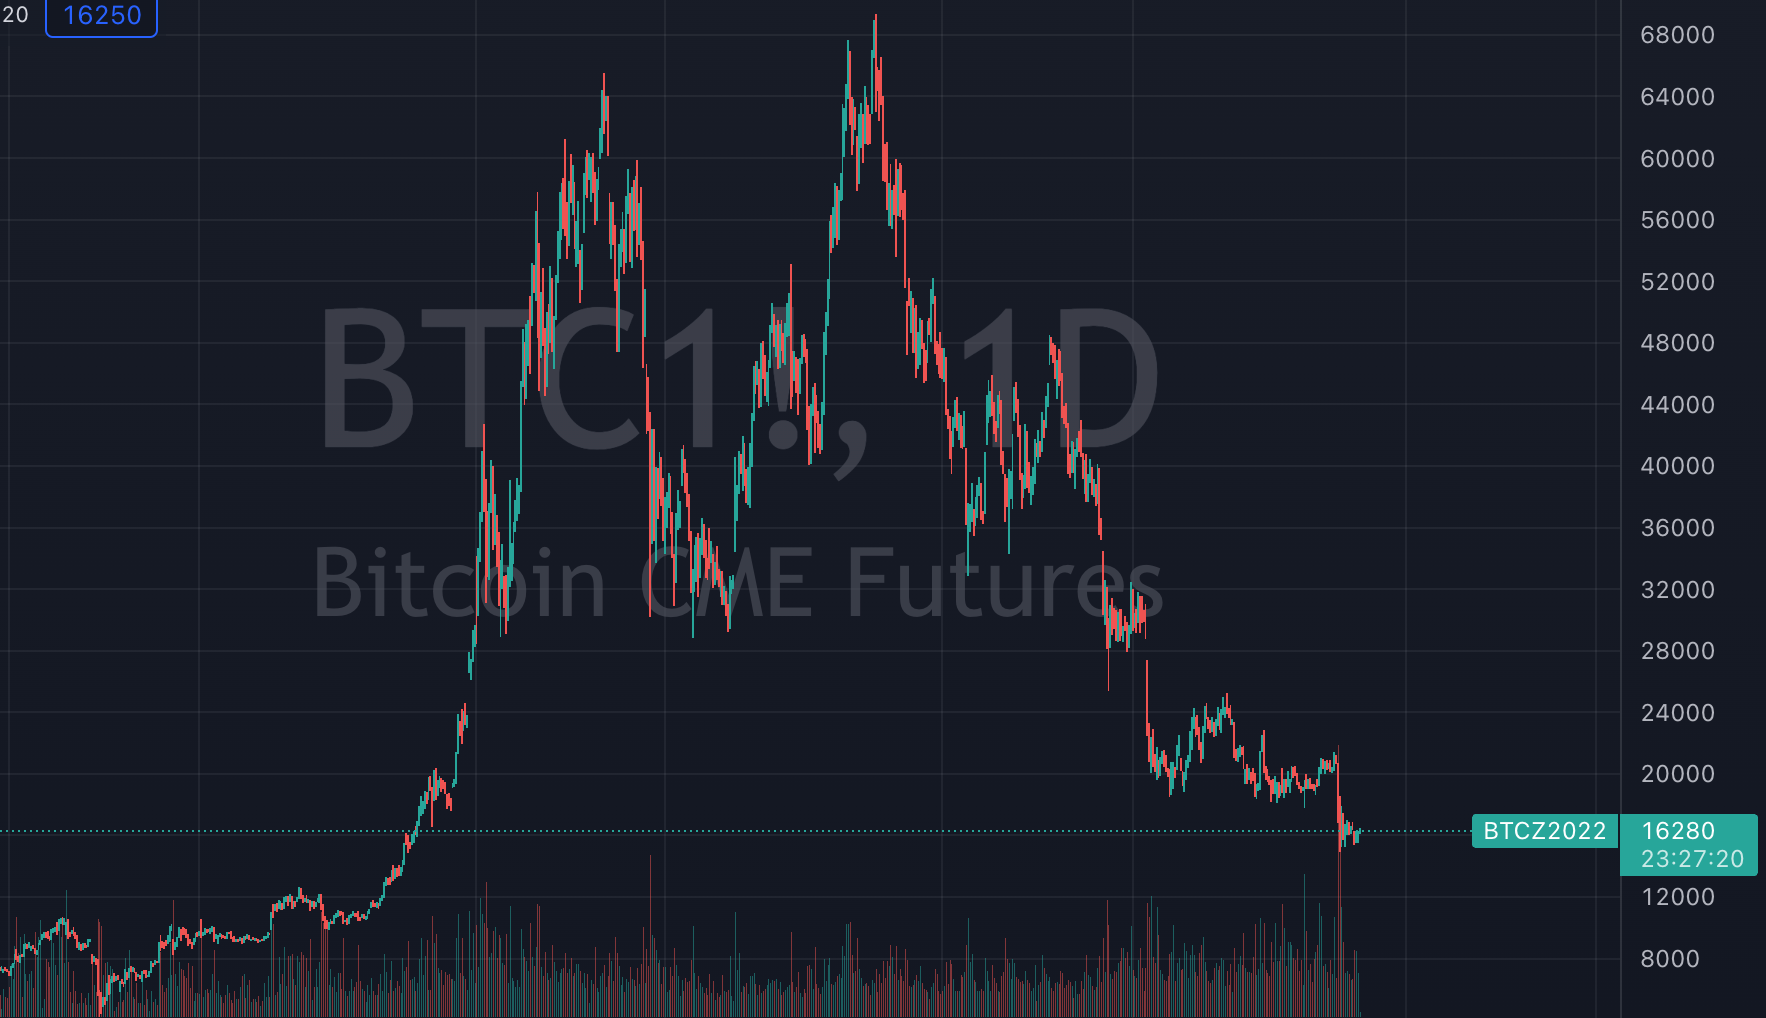
Both charts look horrendous. Both charts do not show any signs of improvement. Sure, they are cheaper today than a year ago, but just because Bitcoin is down 75% doesn’t mean it can’t go down another 75%.
What HAS shown signs of bottoming?
By contrast, let’s look at segments of the market that HAVE bottomed and are at the beginning stages of an up cycle.
👑 Gold mining companies.
This is the daily chart of GDX which is the gold miners ETF (exchange traded fund - a basket of top gold mining companies).

As you can see, GDX had exhausted much of its selling…chopped sideways for some time, formed a bottoming pattern, then broke above this pattern and is continuing higher with strength.
What’s not visible on this chart is the above average recent volume. This is another indicator of money rotating here.
Let’s look at another…
I-80 Gold. This is a gold miner/developer in Nevada. It’s one of my favorites.

What do we see? Same bottoming pattern plus a significant breakout from the dotted green downtrend line. CLASSIC breakout. Again, what you don’t see here is the volume. HUGE volume. 5x the normal volume of shares traded.
And another…
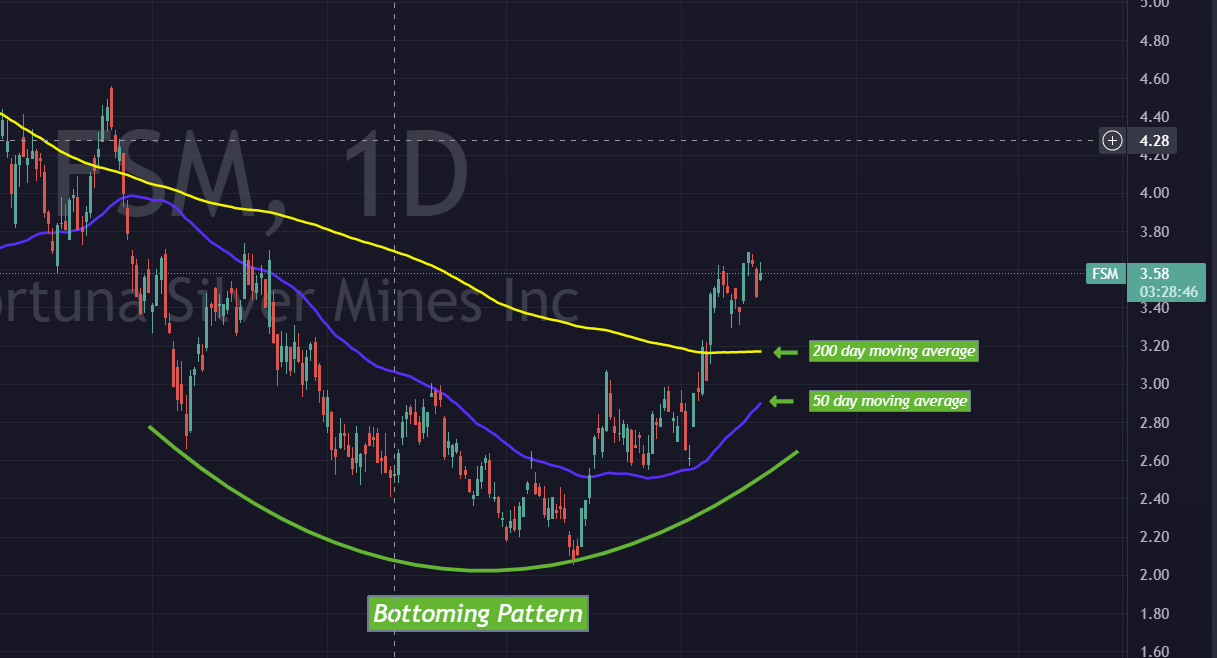
Fortuna Silver Mines (FSM)
Bottoming pattern. Price rising in stair step fashion off bottom. Breaking the down trend. Price above both the 50 and 200 day moving average. 50 day moving average (blue) curling up and ready to break above 200 day.
“Me likey. My likey a lot.” - - Eric Hyde, just now.
I could go on and on in the gold and silver complex but I think you get the idea.
Seeing these patterns play out over the last many months, I’ve been accumulating shares…at DIRT CHEAP valuations…because NOBODY is looking here.
Okay, quick summary:
Markets bottom at different times. General equities like the Nasdaq or the S&P500 do not show signs of a bottom yet. Precious metals, on the other hand, are showing signs of having bottomed already.
Continuing…
Let’s look at how interest rates affect markets now.
Fed Funds Rate
We know what happens when the Fed hikes interest rates. We’ve all seen it in 2022. Look at your 401K. Look at mortgage rates. Unless you held cash or specific energy stocks, you have paper losses (or actual losses of you’ve sold out).
So what happens when the Fed STOPS hiking rates? I won’t pretend to know when they will eventually lower rates, so let’s just focus on when they stop hiking. At some point they will. I think we are closer to the end of the hiking cycle than the beginning. I’ll say that.
Historically, gold bottoms several months before the Fed STOPS raising rates. This coincides with what the charts are telling us.
Okay, but what about the broader markets like the Nasdaq or S&P 500? When will they bottom?
Again...charts. I live by charts. See the chart below.

The dark blue line represents Fed Funds Rate. You can see each rate hiking cycle. At the top of each cycle, there is a small flat line. This is when the Fed STOPS hiking. Not lowering rates…but no longer hiking (much like we are about to see in the coming months). Some flat lines are longer than others. In those cases that means it took longer for the Fed to begin lowering rates.
What you’ll notice is that the market does not bottom until much later, 6-9 months on average…and that isn’t until the Fed actually LOWERS RATES.
And I think that is far off.
So if history is a guide, then this tells me we have not yet seen a bottom in broad markets and we won’t see a bottom until months after the Fed begins lowering rates.
Analysts are predicting this to begin at the end of 2023/ early 2024. But of course, anything can happen.
Could markets rally in the meantime. Of course. They often DO in bear markets. Will markets rally in December if the Fed raises “only” .50% or .25% and talks a soft game? As we’ve seen….indeed.
I believe that will be short lived.
Why?
Recession. Layoffs. Earnings cuts. Crazy stupid inflation. Yes, 7.7% inflation rate is still stupid inflation. Lower than 9.1%? Yes. Still stupid high? Double yes. Transitory? Lol. Cute.
We have YET to see the impact of the last 4 rate hikes of .75% each, not to mention the .25% we started with earlier in the year.
There is usually about a 6 month lag from hiking rates to seeing the effect of these hikes. When rates are hiked at such a rapid pace like we’ve seen…shit happens. 2023 will be the shit. And not the good kinda shit.
We are already starting to see unemployment tick up slightly. This uptick in unemployment isn’t yet taking into account the announced layoffs:
Twitter: 75% of employees
Meta: 11,000 employees
Amazon: 10,000 employees
HP: 6,000 employees
Robinhood: 30% of employees
Intel: 20% of employees
Snapchat: 20% of employees
Apple: Hiring freeze
And so on and so forth…………
Sooooooo…..
✅ Gold typically bottoms several months before rate hiking cycles end
✅ Technicals on gold forming a bottom - liftoff looks to have begun
✅ Fed signaling slowing the pace of rate hikes - closer to the end
⭕️ Broad markets bottom 6-9 months after fed starts to lower rates - not yet
So there you have it. MY OPINION…and my opinion only. Could I be wrong?
ABSOLUTELY. I’m always wrong. Ask my wife. Lol. (Hi babe! Love you)
The caveat to all of this is ultimately what the Fed decides to do and say. They control the markets, unfortunately.
If something like the bond market ‘breaks’ tomorrow and the Fed begins more QE and subsequently lowers rates…all bets are off. In that case…buy the SHIT out of gold and silver! (REAL money)


Bonus Material on Gold
This is an important time of year for large institutions, hedge funds, and banks because this is when they start to shift large amounts of money. They start the year with MAJOR asset class recommendations.
Yesterday and last week I noticed that J.P. Morgan and other banks are now advising their clients to buy Gold. I believe they are seeing the writing on the wall.
On November 23rd, J.P. Morgan’s Global Commodities Research Report stated:
“With the Fed on pause, decreasing US real yields drive our bullish baseline outlook for gold and silver prices. We forecast gold prices will push to an average price of $1,860/oz into 4Q23. We believe the risk is skewed to the upside in 2023. A harder-than-expected economic landing in the US would not only attract additional safe haven buying but the rally could become supercharged by more dramatic decreases in yields if the Fed more rapidly unwinds tighter fiscal policy.”
Today, their research is telling those same clients to also sell oil.
The shuffling of client money is now in full swing.
Does that means gold will be higher and oil will be lower a month from now? That depends. There are several other factors at play here but this is significant.
This is why I’ve been positioning ahead of big money. This is one of the many signals I’ve been waiting for.
That’s all for this week. Thanks for reading. And remember, please share this free newsletter to reach more people.
Eric